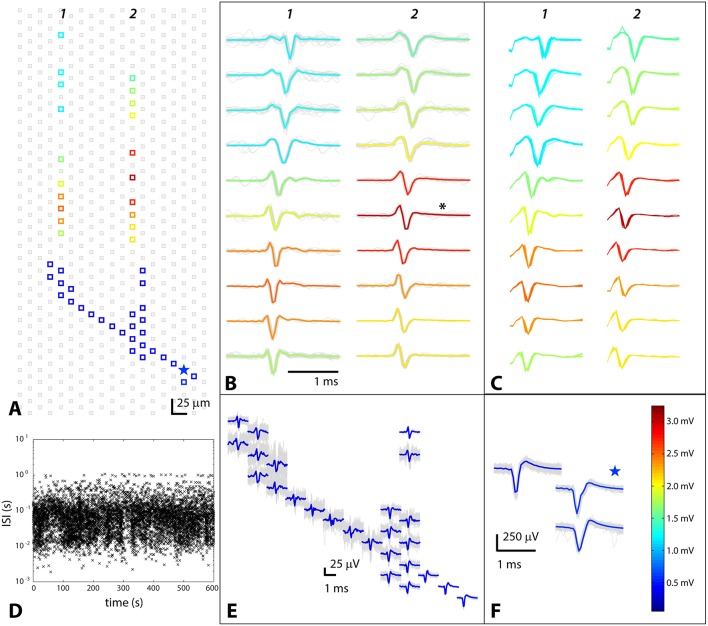
Figure 1.
Triggered spontaneous scan to identify axon and axonal branches belonging to a cell whose somatic location was known. Data from electrodes near the soma were spike sorted, and the resulting spike times were correlated with spikes on other electrodes on the chip. The colors of the spikes encode their amplitude, as indicated by the scale bar in (F). (A) Positions of electrodes where spikes were detected, with putative soma designated by a star; (B) Spontaneous axonal waveforms in PDMS channels; asterisk denotes electrode from which data shown in Figure 2 was taken; (C) Stimulation-evoked spikes on the same electrodes as in (B); (D) Inter-spike interval (ISI) vs. time to illustrate spontaneous behavior of the cell; (E) Small axonal spikes outside of PDMS channels buried in noise; (F) Spikes on fixed electrodes near soma; star denotes putative soma location.

