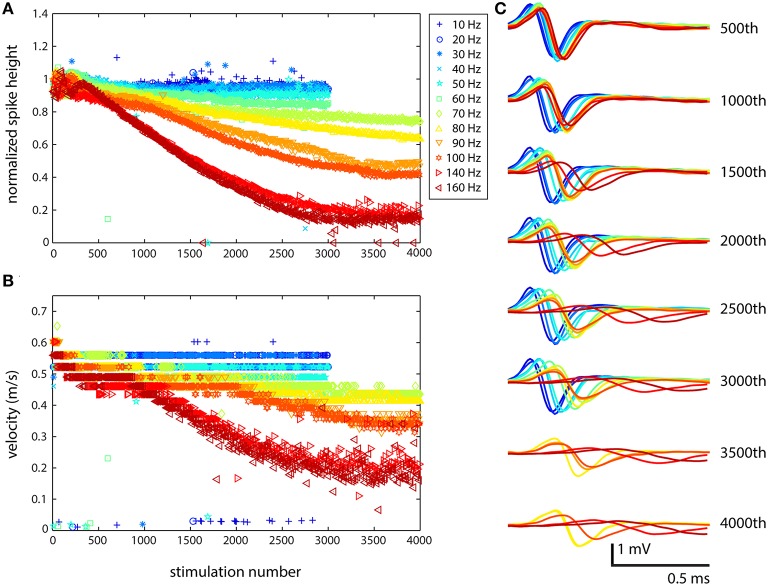
Figure 2.
Stimulation at medium to high frequencies results in highly altered axonal waveforms. The cell was stimulated from 10 to 160 Hz, and because of the large waveforms in the channels, it was possible to very clearly observe the changes in waveform. (A) Large effects to the spike shape resulting from stimulation were not observed until stimulation at 80 Hz (yellow). At higher frequencies and following a larger number of stimulations, the effects were more dramatic. (B) Propagation velocity was also affected by stimulation: propagation slowed down at higher frequencies. (C) The change in shape of the waveform from top (500th stimulation) to bottom (4000th stimulation) shows the stereotypical behavior: decrease in spike height, increase in spike width, and increase in latency. The electrode from which these data were recorded is designated in Figure 1B with a black asterisk. Similar results were obtained for all electrodes in channels that were recorded from. Color corresponds to stimulation frequency.

