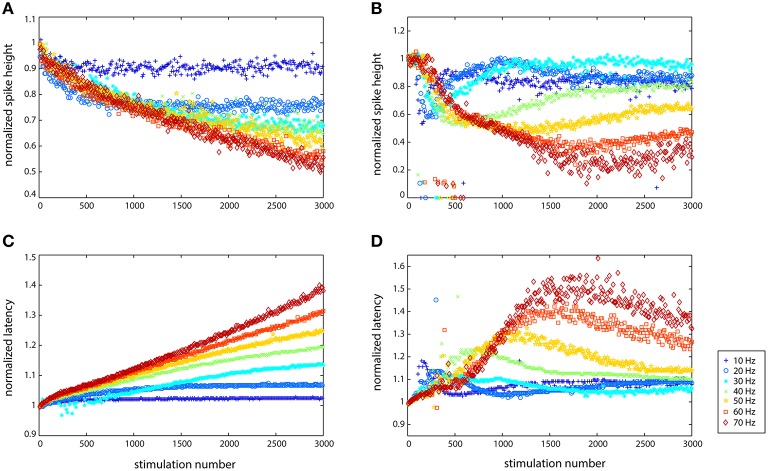
Figure 3.
Cells reacted differently to stimulation depending on their spontaneous characteristics (rate and spiking type) with regard to spike height (A,B) and spike latency (C,D). Data from two different cells is shown here. (A,C) Largely linear responses of the axon of one cell (cell 9123 in Figure 4), especially with regard to latency. (B,D) Adaptive behavior of another cell (cell 1237 in Figure 4), which responded non-linearly at every stimulation frequency that it was subjected to, but then recovered more (10 Hz) or less (70 Hz) in terms of both spike size and latency increase.

