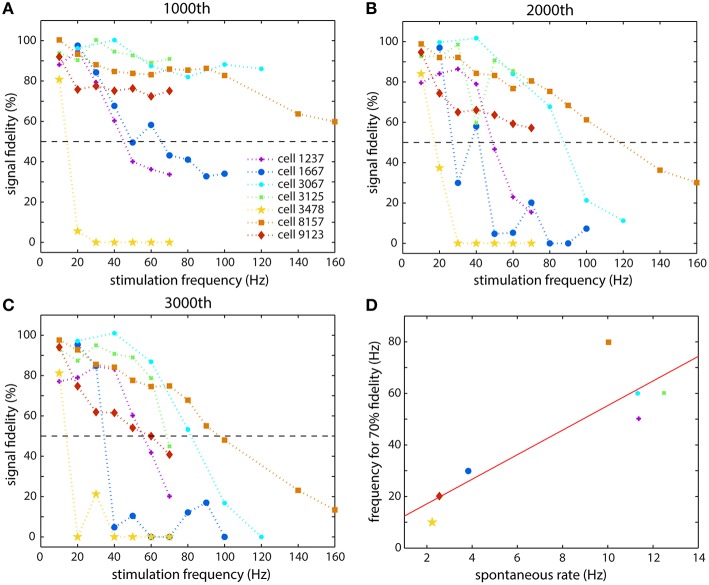
Figure 4.
Summary of the responses of seven different cells that were studied. The spike fidelity (normalized spike height minus normalized latency) is shown for each cell at each stimulation frequency at different time points: (A) after 1000 stimulations, (B) after 2000 stimulations, and (C) after 3000 stimulations. (D) The spontaneous firing rate of a cell appeared to be related to the stimulation frequency that it could propagate faithfully. The abscissa is the average spontaneous spiking frequency of the cell and the ordinate is the frequency that the cell could propagate with 70% fidelity, taken from (C).

