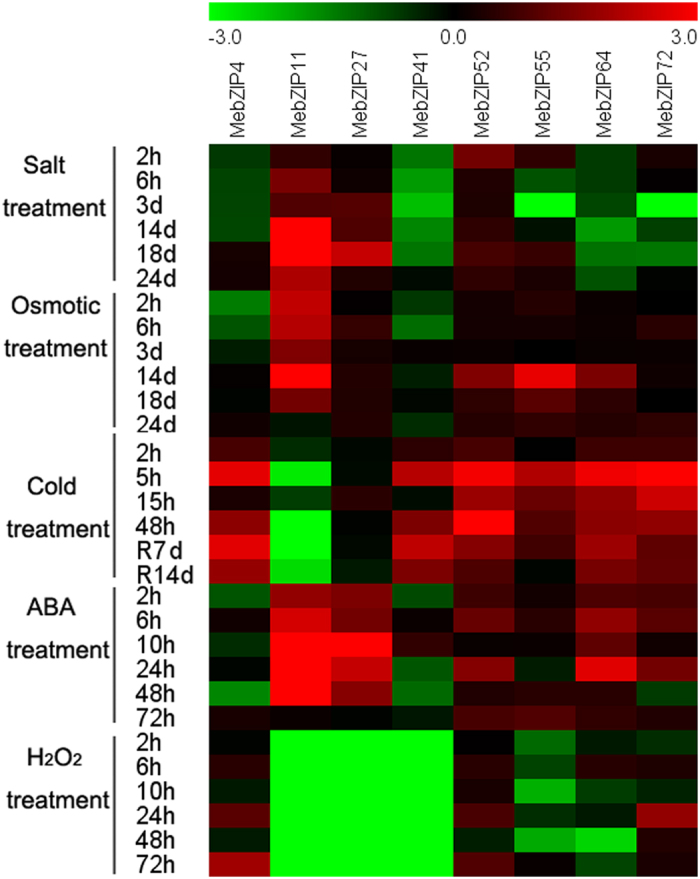
Figure 6. Expression profiles of MebZIP genes in leaves under various stimuli.

Log2 based values from three replicates of quantitative real-time PCR data were used to create the heatmap. The scale represents the relative signal intensity values.

Log2 based values from three replicates of quantitative real-time PCR data were used to create the heatmap. The scale represents the relative signal intensity values.