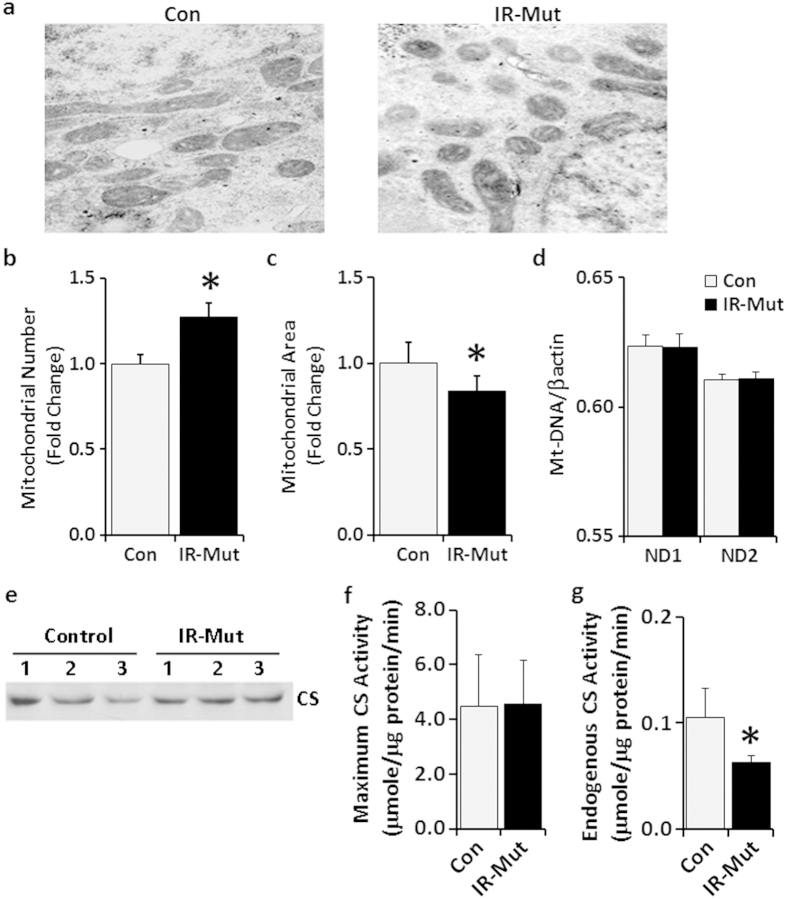
Figure 1. Decreased mitochondrial area and CS activity in IR-Mut iPSC.
(a) Representative electron micrographs of control and IR-Mut iPSC. (b) Quantification of the number of mitochondria relative to total cellular area. Images at 4500X; 9 micrographs/cell line. (c) Quantification of the area of mitochondria relative to total cellular area. Images at 34000X; 5 micrographs/cell line. (d) Mitochondrial DNA content, as determined by qRT-PCR using primers for mt-ND1 and mt-ND2, with nuclear beta actin as control (n = 3). (e) Expression of CS protein by representative western blot. (f,g) Assay for maximal (f) and endogenous (g) citrate synthase activity measured as μmole/min and normalised to cellular protein (n = 3). *indicates p < 0.05 for IR-Mut vs. control.

