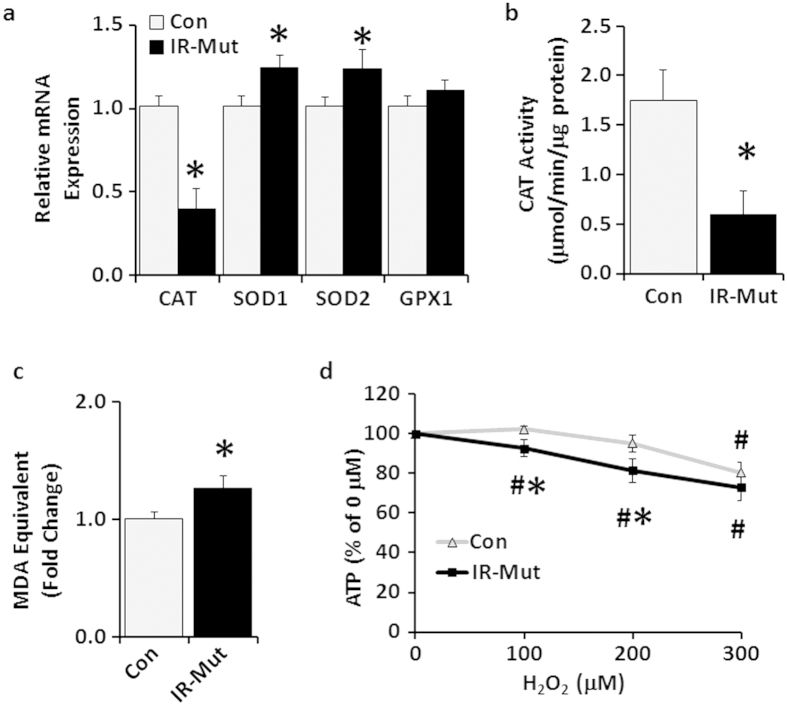
Figure 6. IR-Mut iPSC have increased oxidative stress.
(a) Relative mRNA expression of antioxidant enzymes, as assessed by qRT-PCR. Data are normalised to 36B4 and expressed relative to control (n = 3). (b) Catalase activity was measured as μmole/min and normalised to cellular protein (n = 3). (c) Lipid peroxidation was calculated by MDA equivalents using TBARS assay (n = 3). (d) ATP level expressed relative to vehicle (0 μM H2O2) (n = 2 of 4 Con vs 4 IR-Mut and n = 1 of 2 Con vs 3 IR-Mut). *p < 0.05 for IR-Mut vs. control. #p < 0.05 vs. vehicle.

