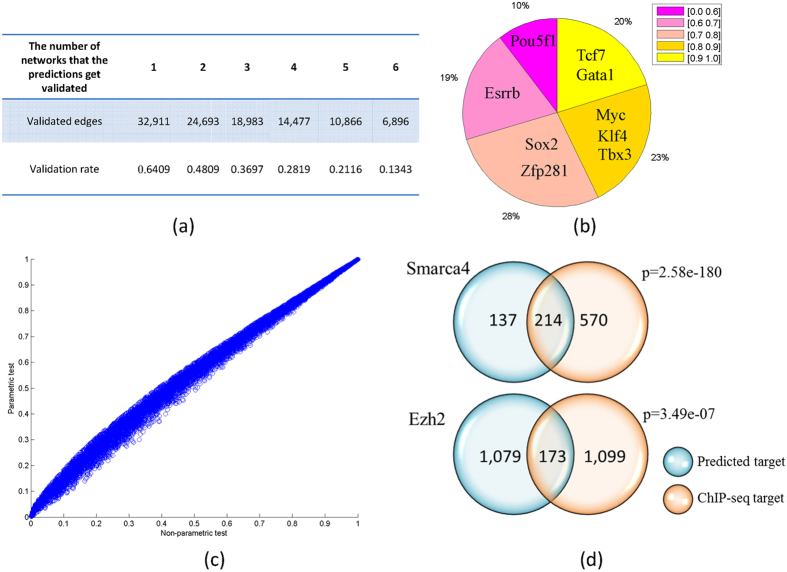
Figure 2. Validation of MOCHA predictions.
(a) The inferred transcriptional regulation network is validated by six DNase-seq data derived networks. The smallest DNase-seq data derived network has 781,636 edges and the biggest one has 989,520 edges. (b) Evaluation of the target gene prediction for each TF by mutual information. AUC score for each TF is computed and shown in pie graph. Each color means a bin for AUC score, for example [0, 0.6], [0.6, 0.7], [0.7, 0.8], [0.8, 0.9] and [0.9, 1.0].The percentage represents the percent of TFs in each AUC bin. (c) Comparison of liquid association p-values computed by our method and non-parametric permutation test. (d) Comparison of predicted CR target genes and CRs’ target genes measured by ChIP-seq. We apply our method to predict target genes on polycomb complex member Ezh2 and BAF complex member Smarca4 (BAF190) which have ChIP-seq data to compare in mESC. As a result, 214 out of 351 and 173 out of 1,252 target genes are validated by the Smarca4 and Ezh2 ChIP-seq data respectively. Both of these two overlapping are significant by hypergeometrical test.

