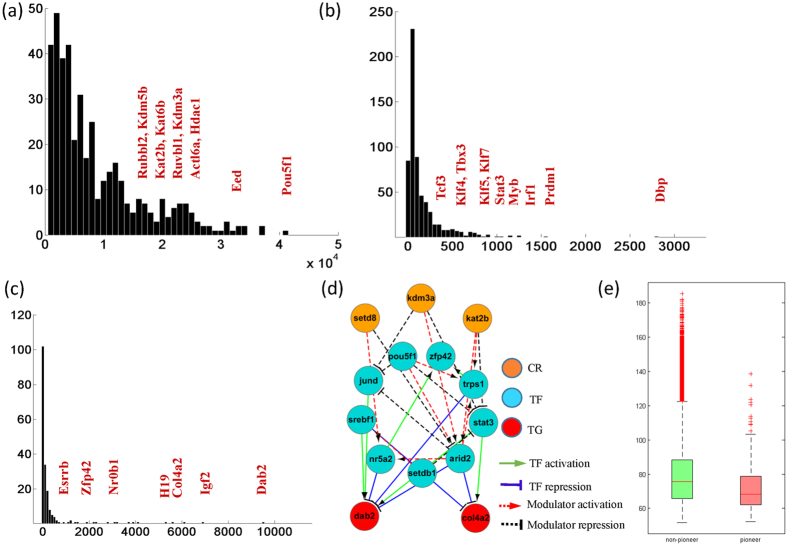
Figure 4. Topology analysis of the modulation network.
(a) Histogram of the chromatin regulation scores for CRs. (b) Histogram of the number of TFs in the triplets. (c) Histogram of the number of target genes in the triplets. (d) A module in modulation network. (e) Comparison of in-degree of pioneer TFs and non-pioneer TFs in modulation network.

