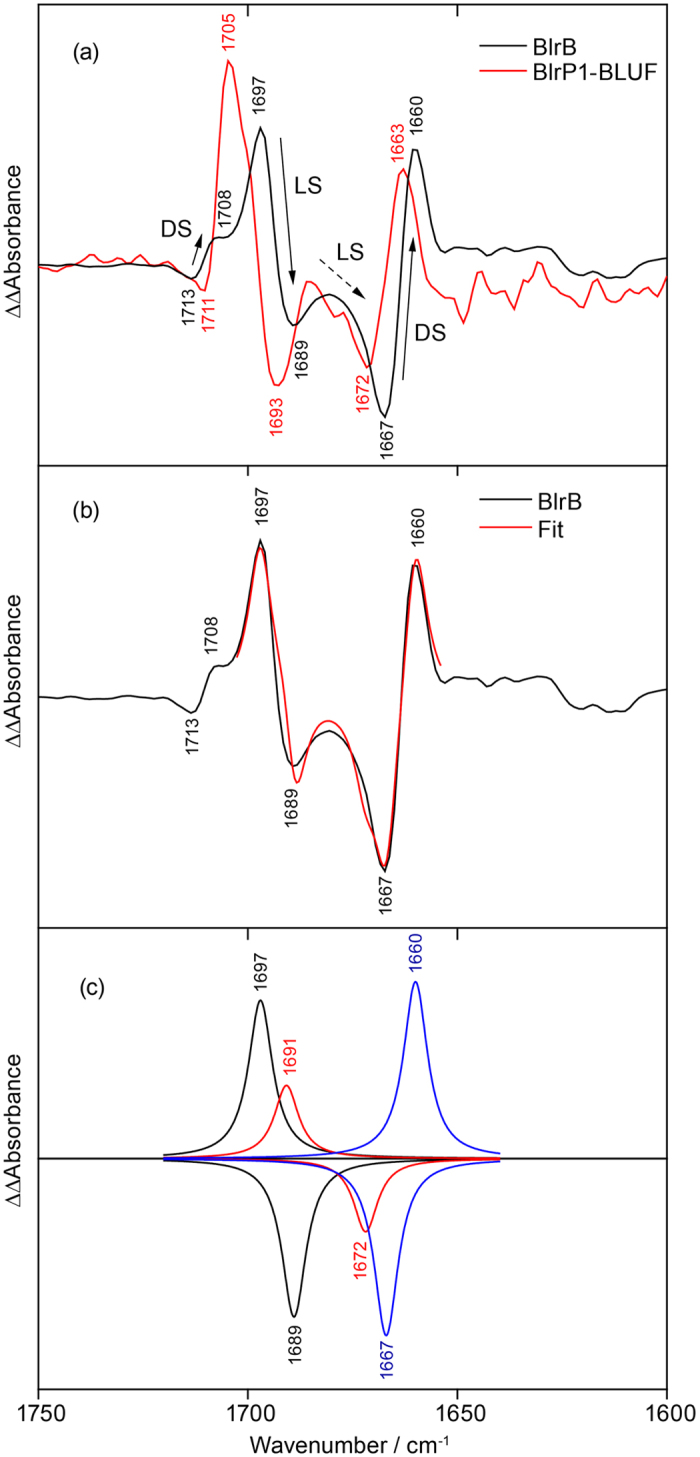
Figure 4. Double difference spectra of unlabelled minus labelled FTIR difference spectra for BlrB and BlrP1-BLUF and their analysis.

(a) The double difference spectra of the two BLUF domains show a similar pattern of light- and labelling-induced shifts (BlrB: black, BlrP1-BLUF: red). Arrows in the double difference spectrum of BlrB designate the frequency downshifts caused by labelling of at least three difference bands originating either from the dark state (DL) or the light state (LS). (b) Fit of the experimental spectrum of BlrB (black) by a sum of six Lorentzians (red). (c) Three pairs of the Lorentzians as a result of the fit (black, red, blue). The additional band pair at 1,691(+)/1,672(−) cm−1 (red) is not obvious from the experimental spectrum but needs to be included in order to reach a reasonable agreement between the fit and the experiment.
