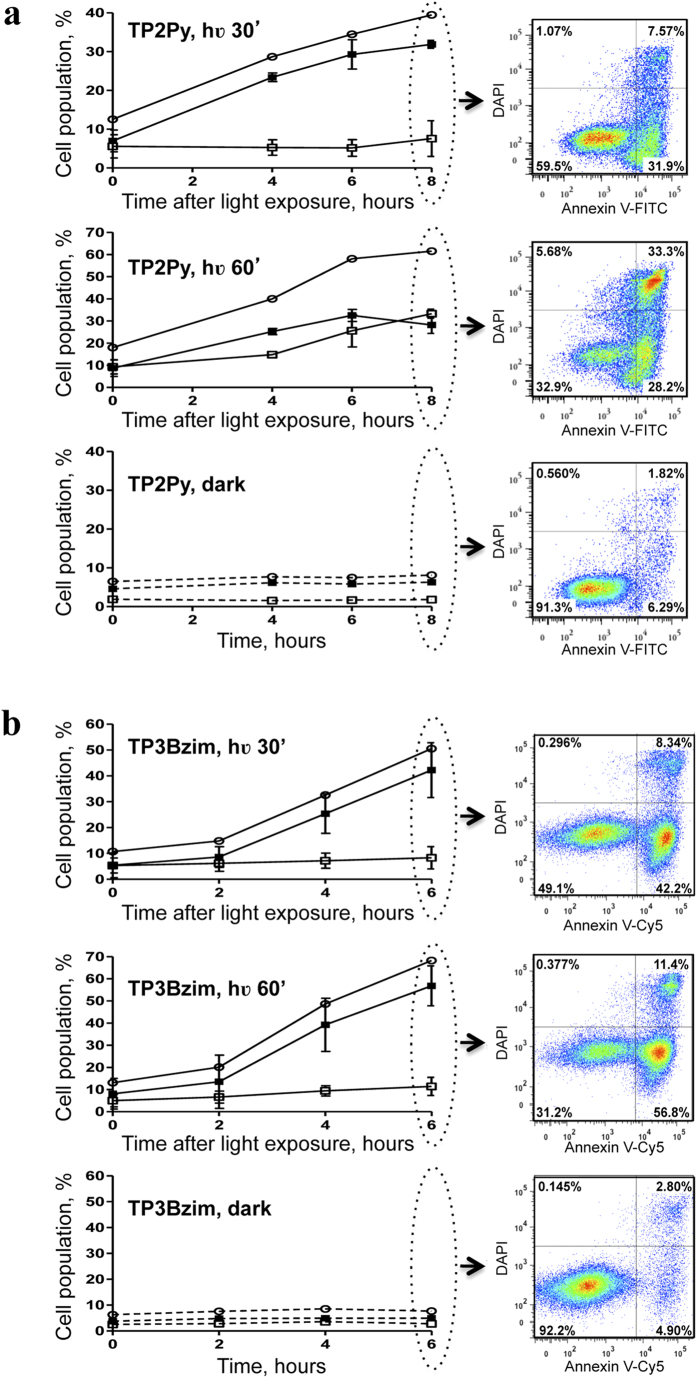
Figure 5. TPAs induce cell apoptosis upon light illumination as revealed by Annexin V/DAPI staining.
Living Jurkat cells were treated with 2 μM TP2Py (a) or TP3Bzim (b) (as indicated in Methods) and subjected to light illumination for 30 (top) or 60 min (middle). The source of excitation was a Mercury lamp (130 W; 380–600 nm) with an excitation filter centered at 452 nm (±45 nm) (irradiance, 17 mW.cm−2). The cells were then further incubated for various times in the dark at 37 °C before Annexin V/DAPI treatment and flow cytometric analyses. Cell populations corresponding to apoptotic and necrotic (or late apoptotic) cells were plotted as a function of time after light exposure. Bottom: control population of TPA-treated cells without light exposure. Black squares: apoptotic cells (Annexin V+, DAPI−); white squares: necrotic/late apoptotic cells (Annexin V+, DAPI+); white circles: total number of dead cells (Annexin V+, DAPI+/−). Error bars indicate S.D. (n = 3). Right: examples of 2-dimensional dot plots for t = 8h (TP2Py) or 6h (TP3Bzim) (the complete study is shown in Supplementary Fig. 1). All the cells selected for the analysis of Annexin V/DAPI staining were positive for TPA fluorescence.

