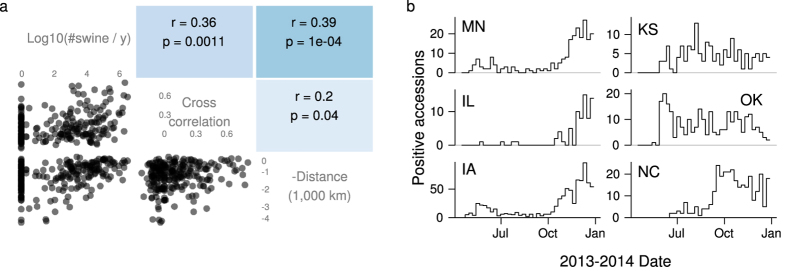
Figure 3. Similarity between state’s PED dynamics correlated more strongly with transport flows than with distance.
(a) Scatter plots and Pearson correlations between transport flows, cross correlations between time series of positive accessions, and negative geographic distances. The  values are from a Mantel test. (b) PED dynamics for selected states. Distinct shapes are apparent in the time series of the Midwestern states (MN, IL, IA), Kansas and Oklahoma, and North Carolina.

