
Figure 4. Transport flows were predictive of the number of new positive accessions.
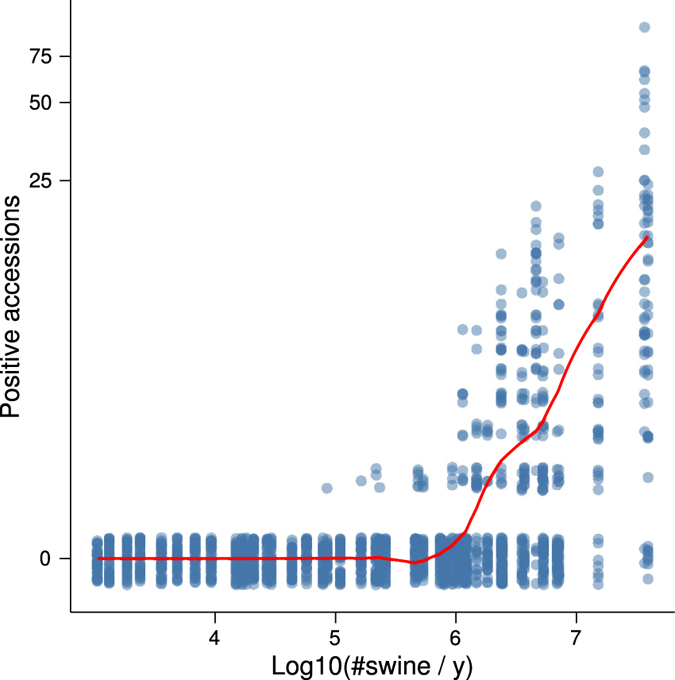
The line is a LOESS smoother of predicted values from the undirected model, where predictions were calculated for each observation by adding fixed effects and conditional modes of random effects. The points are the original data. To display their density, they have been made transparent and jittered along the  axis. The
  axis was transformed using y = log (Positive accessions +1).