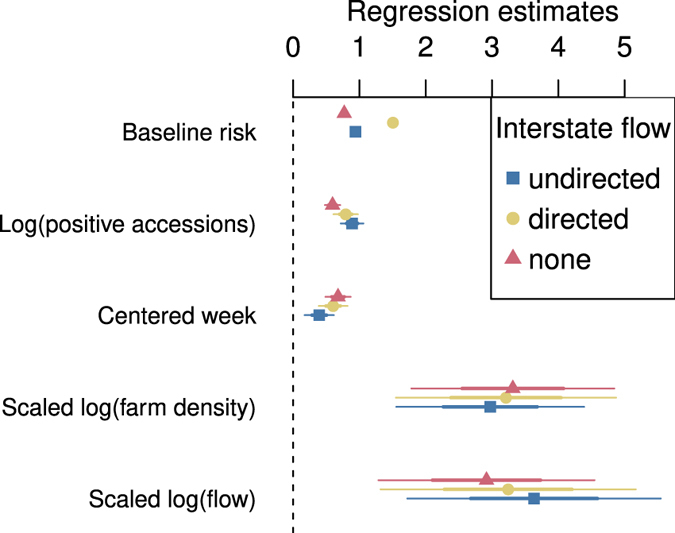
Figure 5. Parameter estimates for the transmission model.

The estimates are not sensitive to the choice of interstate flow model, and flows have similar effect sizes to farm densities. Baseline risk refers to the parameter  , which determines the risk of infection when no infectives are present. The error bars represent 50- and 95-percent Wald confidence intervals. The scaled variables were divided by the interquartile ranges to make their effect estimates comparable. The interquartile ranges for week and the logarithm of farm density were 19.0 and 4.5. Those for the logarithm of undirected, directed, and internal (no interstate) transport flows were 4.5, 4.3 and 3.8.
