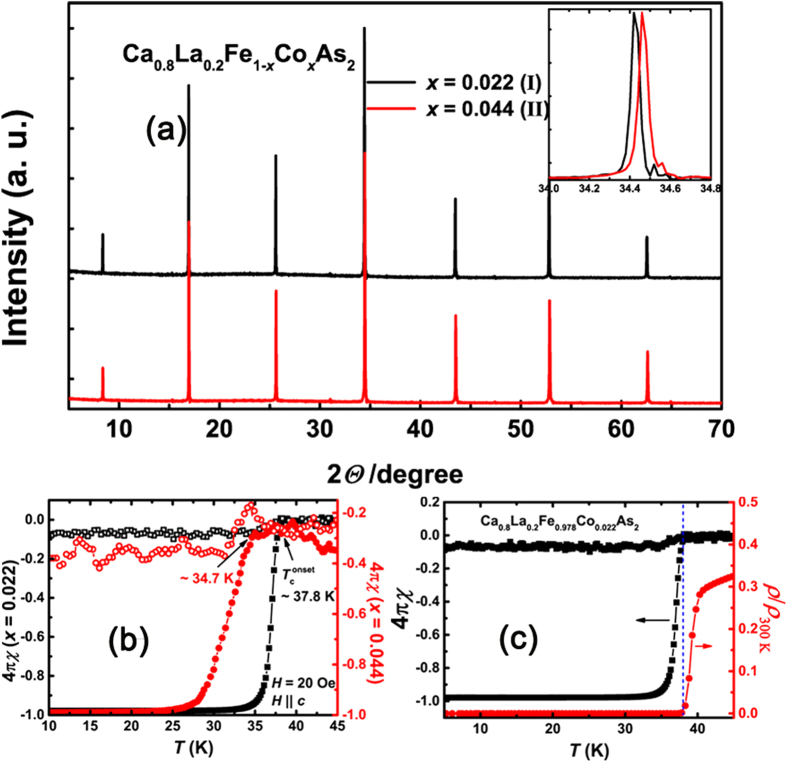
Figure 1.
(a) XRD patterns for Ca0.8La0.2Fe1−xCoxAs2 single crystals. Inset: Comparison of the (004) peak between two crystals with different doping levels. (b) Temperature dependence of the DC magnetic susceptibility (demagnetization corrected) for sample I (black) and sample II (red). The original magnetization data were collected by zero-field cooling (ZFC, solid symbols) and field cooling (FC, open symbols) processes. (c) Temperature dependence of resistivity and SC volume fraction for Ca0.8La0.2Fe1−xCoxAs2 (x = 0.022). Consistent resistive and magnetic transitions can be observed.

