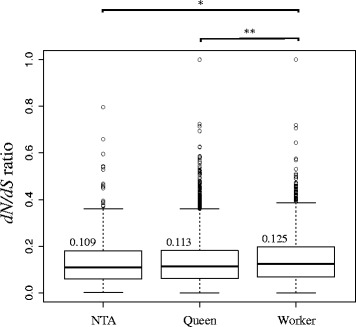
Fig. 3.

Box plots showing the distribution of d N/d S ratios before accounting for OGG connectivity and expression levels for OGGs in non-caste-associated modules (NTA), OGGs in queen-associated modules (Queen) and OGGs in worker-associated modules (Worker), and calculated using PAML. The median d N/d S values are indicated above the boxplot. OGGs in worker-associated modules had significantly higher d N/d S than OGGs in queen-associated modules, and OGGs in non-caste-associated modules. * p < 0.05, ** p < 0.01
