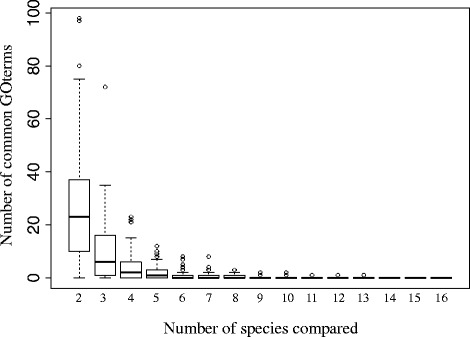
Fig. 5.

No overlap was found in the number of enriched GO terms for caste-biased genes across all 16 species. The plot shows the number of enriched GO terms for caste-biased genes in common in a variable number of randomly selected species (bootstrap resampling 100 times). The results of this analysis parallel findings at the level of individual differentially expressed genes (Fig. 4)
