
Figure 3.
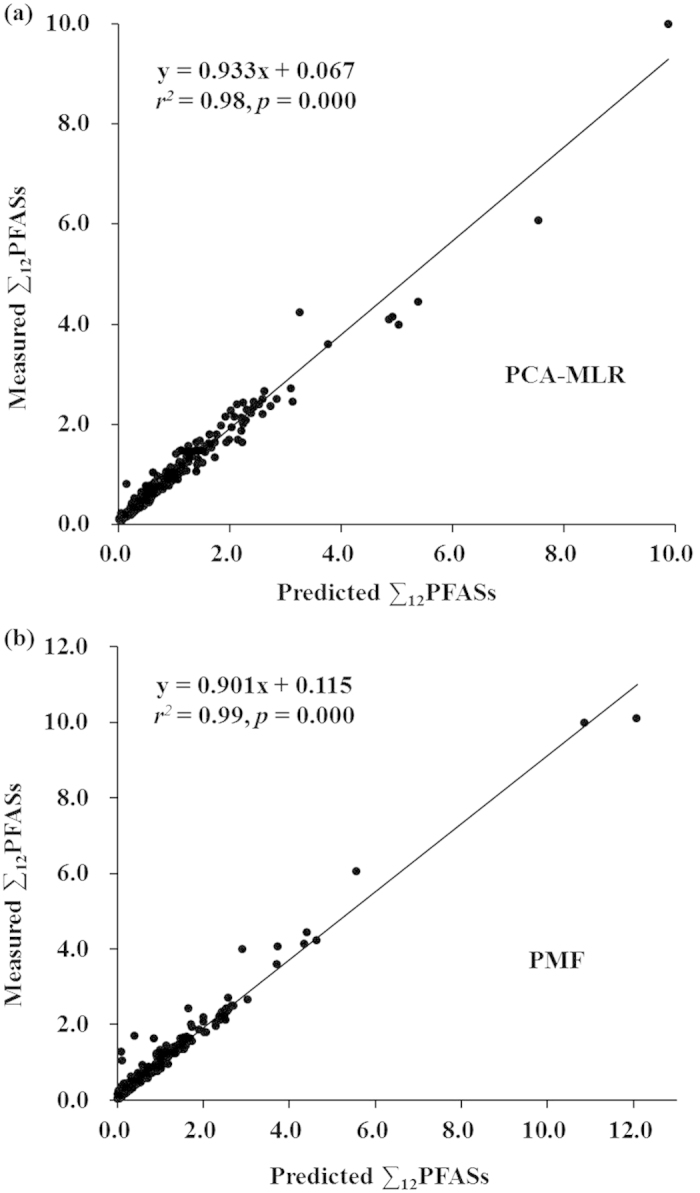
Fitting plots between the modeled and measured ∑12PFASs concentrations (ng/g dw) for all the surface sediments: (a) PCA-MLR, (b) PMF. (We created the map using the Microsoft Office 2010 software for windows 2003/XP/VISTA/7).
Official websites use .gov
A
.gov website belongs to an official
government organization in the United States.
Secure .gov websites use HTTPS
A lock (
) or https:// means you've safely
connected to the .gov website. Share sensitive
information only on official, secure websites.
Fitting plots between the modeled and measured ∑12PFASs concentrations (ng/g dw) for all the surface sediments: (a) PCA-MLR, (b) PMF. (We created the map using the Microsoft Office 2010 software for windows 2003/XP/VISTA/7).