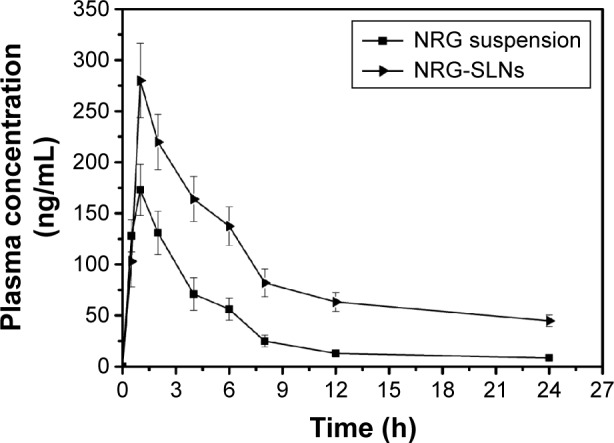
Figure 10.

The mean plasma concentration–time curve of NRG in rats after a single intratracheal dose (20 mg/kg) of NRG suspension and NRG-SLNs.
Note: Each data represent the mean ± standard deviation of five rats.
Abbreviations: NRG, naringenin; SLNs, solid lipid nanoparticles; h, hours.
