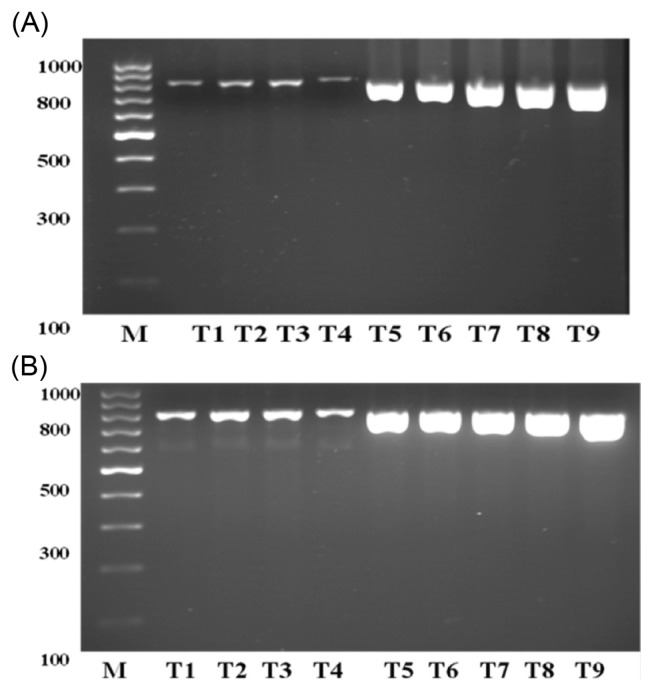
Fig. 2.
Electrophoresis banding pattern after PCR amplification with program 1 (A) and program 2 (B). Lane M, 100 bp DNA ladder standard; T1–T9, different PCR conditions. The amplified DNA fragment sizes (830 bp) were estimated after comparison with a commercial 100 bp DNA ladder. The PCR amplification program 2 gave the best results.

