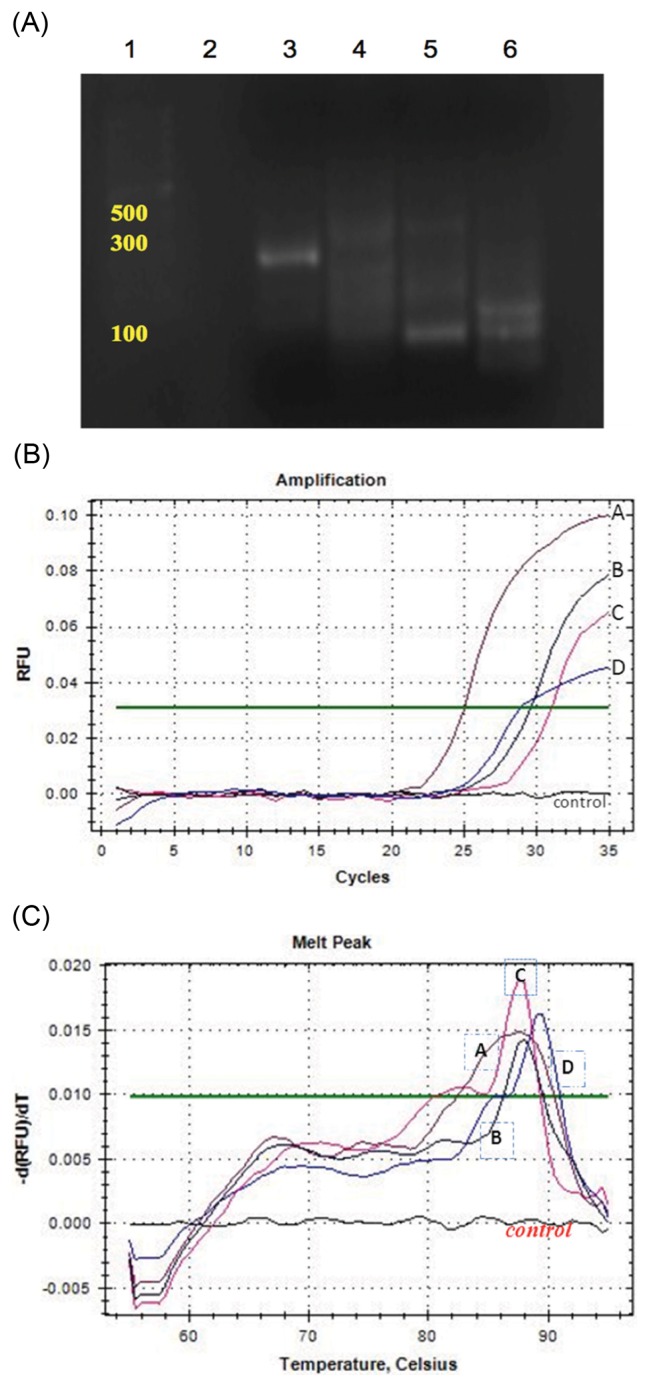
Fig. 5.
Electrophoresis banding patterns of the amplified gene products after electrophoresis on 2% agarose gel (A), amplification curves (B) and melting peaks (C) for the four genes, (tub1, aflM, aflR, and aflD) after Real-time PCR with SYBR Green. (A) Lane 1, 100 bp DNA ladder standard; Lane 2, no template; Lane 3, tub1 (the fungal β-tubulin gene as a positive fungal control); Lane 4, aflM; Lane 5, aflR; Lane 6, aflD. Primer set specificity was tested by conventional PCR before detected by SYBR Green. (B,C) A, aflM; B, tub1 (positive control); C, aflR; D, aflD and control, no template as negative control.

