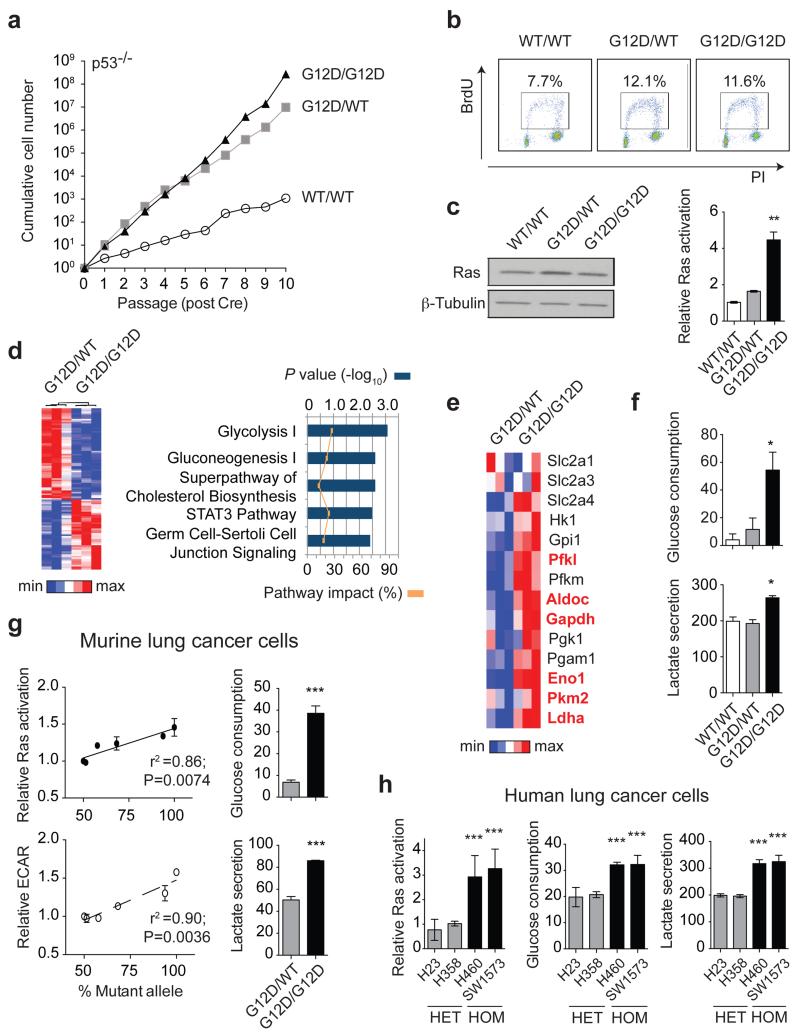
Figure 1. Mutant Kras copy gain upregulates glycolysis in MEFs and lung tumour cells.
a, Proliferative rate of KrasWT/WT (WT/WT), KrasG12D/WT (G12D/WT) and KrasG12D/G12D (G12D/G12D);p53Fx/Fx MEFs. b, FACS analysis denoting BrdU+ MEFs. c, MEF Ras levels (immunoblotting) and activation (Raf-GST pull-down, normalised to WT/WT). d, Heatmap illustrating differential gene expression between G12D/WT and G12D/G12D MEFs (n=3/genotype, microarray); top canonical pathways altered shown (IPA). e, Glycolytic gene expression (MEF microarray-based heatmap). Genes significantly upregulated in G12D/G12D cells highlighted (Bold red, t-test). f, MEF glucose consumption and lactate secretion. g, Left: KrasG12D/KrasTotal allelic frequency (pyrosequencing) versus Ras activation or glycolysis (ECAR) in KrasG12D/WT;p53-deficient murine lung tumour cells (n=6) (Pearson’s correlation). Right: Glucose consumption and lactate secretion in G12D/WT and G12D/G12D cell line pair (t-test). h, Ras activation (normalised to H358), glucose consumption and lactate secretion in KRASmut heterozygous (HET: H23, H358) or homozygous (HOM: H460, SW1573) NSCLC cell lines. c,f,h, one-way ANOVA. a-c, Representative data of three independent MEFs/genotype; d-f, n=3/genotype. g,h, (histograms) Representative data (n=3 independent experiments). All graphs depict triplicate mean ±s.d (error bars). ***P<0.001, **P<0.01, *P<0.05.

