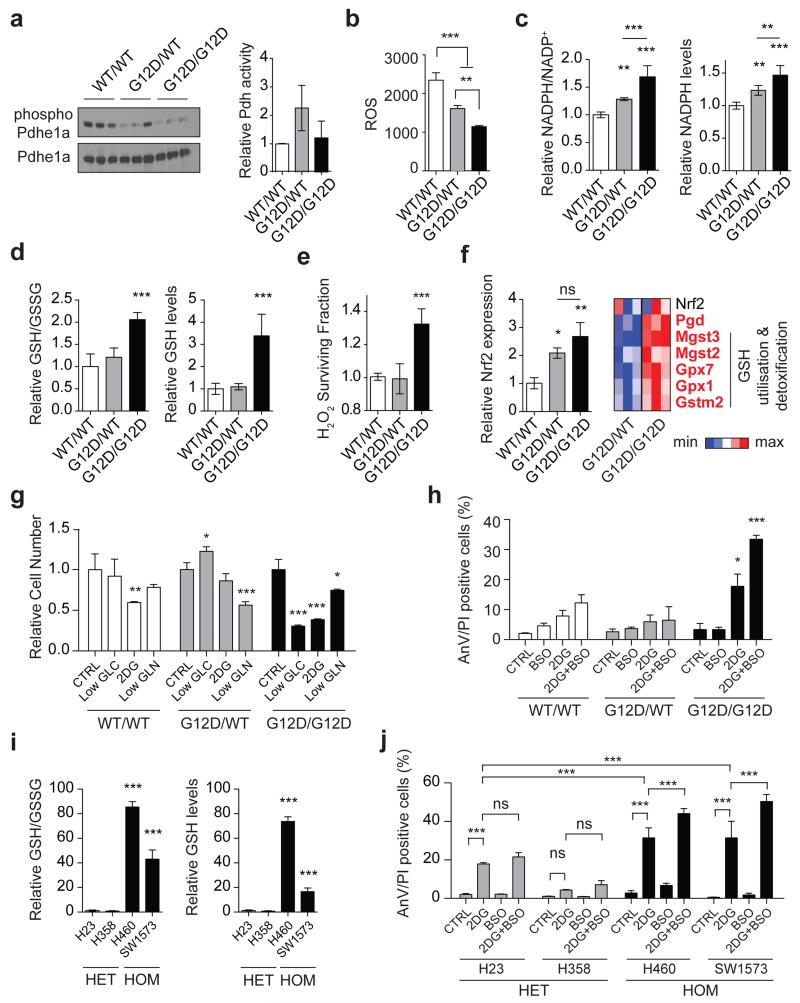
Figure 3. Mutant Kras copy-number dictates redox state, metabolic dependencies and therapeutic susceptibilities.
a, Total and phosphorylated Pdhe1a levels and Pdh activity in MEFs. b, Cellular ROS (CellRox); c, NADPH/NADP+ ratio and NADPH levels; d, GSH/GSSG ratio and GSH levels in MEFs. e, MEF survival upon 24 hrs H2O2 treatment. f, Nrf2 and Nrf2-target gene expression in MEFs (left: qPCR; right: microarray). Nrf2-targets significantly upregulated in homozygous MEFs highlighted (bold red, t-test). g, MEF viability after 72 hrs culture in low glucose (Low GLC), 2DG or low glutamine (Low GLN), relative to normal media (CTRL). h, Percentage of AnnexinV+/PI+ (AnV/PI positive, FACS) MEFs upon 48 hrs BSO, 2DG, or combined (2DG+BSO) treatment. i, GSH/GSSG ratio and GSH levels in KRASmut NSCLC cells. j, NSCLC cells treated as in (h). Triplicate mean ±s.d. shown for three independent MEFs/genotype (a,c,d,f) or for representative data (3 independent runs) (b,e,g,h,i,j). Data normalised to WT/WT (a,c-f) or HET mean (i). One-way (a-f,i) or two-way ANOVA (g,h,j). ***P<0.001, **P<0.01, *P<0.05, ns= not significant.

