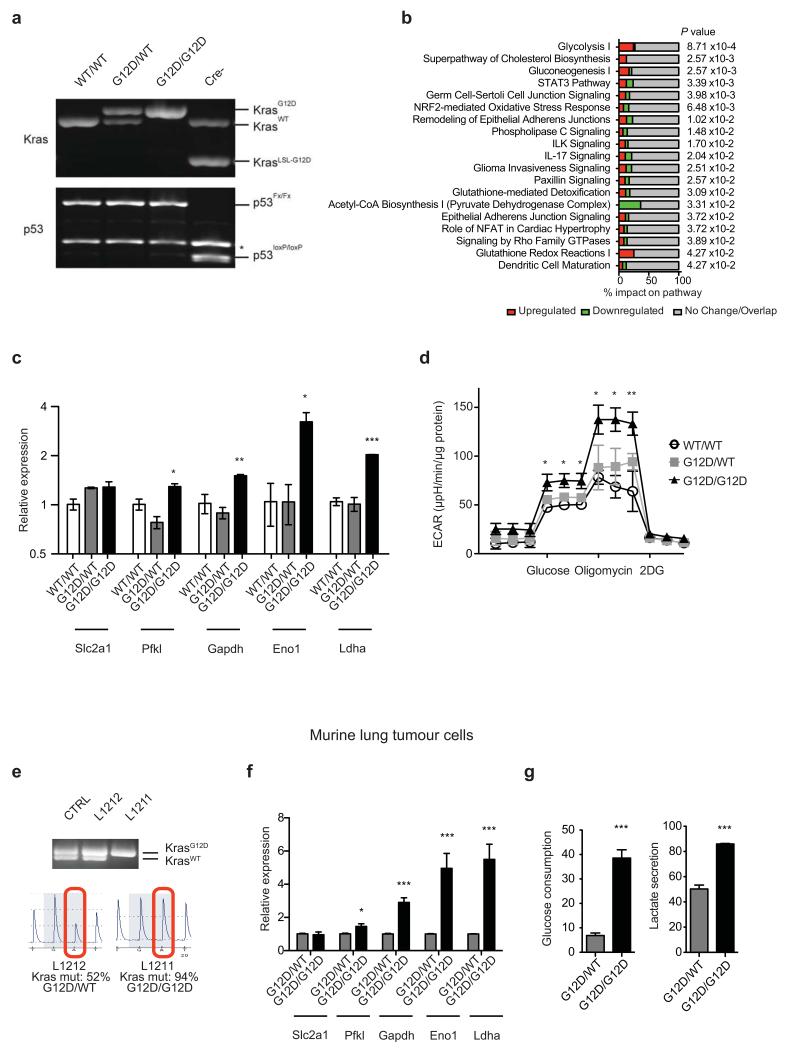
Extended Data Fig. 1. Enhanced glycolysis in homozygous KrasG12D cells.
a, Representative data (n=3) of PCR analysis of the Kras and p53 loci in KrasWT/WT (WT/WT), KrasG12D/WT (G12D/WT) and KrasG12D/G12D (G12D/G12D); p53Fx/Fx MEFs after Cre-mediated recombination; and of unrecombined KrasLSL-G12D/WT;p53loxP/loxP control (Cre-) (*: background band). b, IPA analysis of canonical pathways significantly altered in KrasG12D/G12D relative to KrasG12D/WT MEF transcriptomes (n=3/genotype). c, Representative qPCR data (n=3) of glycolytic gene expression in MEFs. Fold change relative to WT/WT shown as triplicate mean ±s.d. (one-way ANOVA). d, Extracellular acidification rate (ECAR) in MEFs following exposure to glucose, oligomycin and 2DG. Representative data from three independent MEFs/genotype show mean value between triplicates ±s.d. (two-way ANOVA). e, Kras locus analysis of two lung cancer cell lines (L1212 and L1211) generated from spontaneous tumours from KrasG12D/WT;p53-deficient mice. PCR (top) and pyrosequencing (lower panel) analysis shown (L1212: Kras heterozygous - G12D/WT; L1211: G12D homozygous - G12D/G12D). Recombined heterozygous MEFs shown as PCR control (CTRL). f, Representative qPCR data (n=3) of glycolytic gene expression in L1211 and L1212 lung tumour cells. Fold change relative to heterozygous cells shown (mean of triplicates ±s.d., ***P=<0.001, *P<0.05, t-test). g, Left: basal glucose consumption in murine lung tumour cells determined by FACS analysis of 6-NBDG uptake (%). *P=0.02, t-test. Right: extracellular lactate concentration (ng/dl/cell) in murine lung tumour cells. Data are triplicate mean ±s.d. *P=0.0139, t-test.

