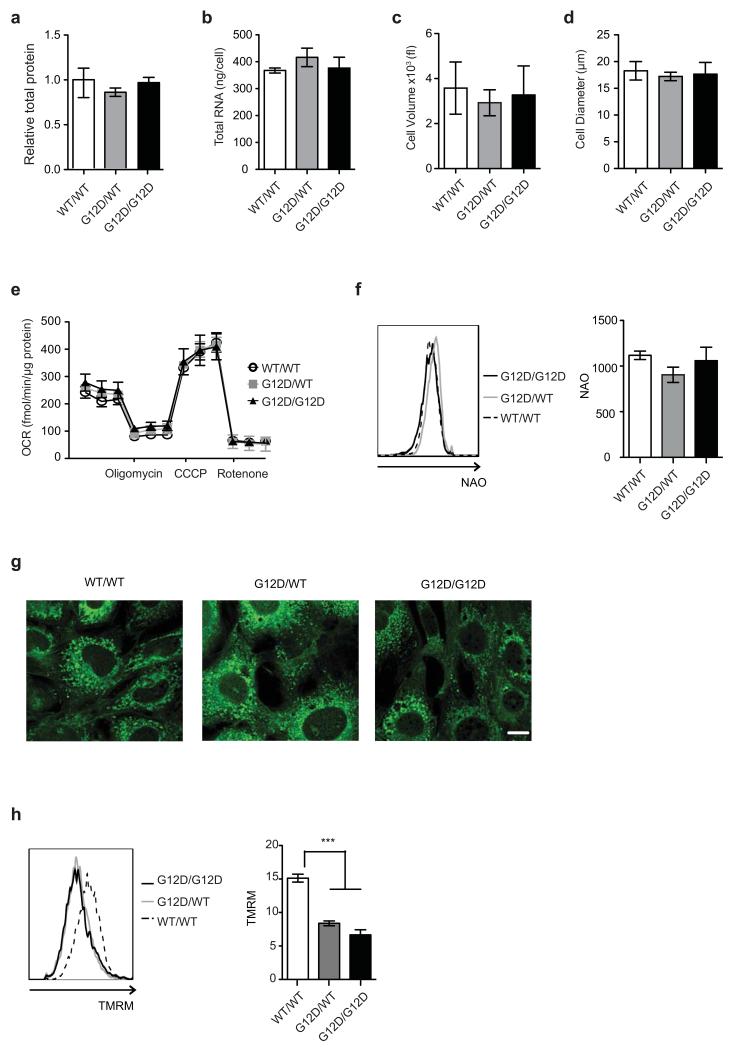
Extended Data Fig. 2. KrasG12D/WT and KrasG12D/G12D MEFs have similar biomass and mitochondrial functionality.
a, Total protein content in indicated MEFs relative to WT/WT. b, Total RNA per cell for each of the indicated genotypes. c, d, WT/WT, G12D/WT and G12D/G12D MEFs were profiled by CASY counter (Roche) and cell volume (c) and diameter (d) measured. a-d, Mean value of three independent MEF triplicates/genotype ±s.d. shown. e, Oxygen consumption rate (OCR) of MEFs in response to oligomycin, CCCP and rotenone (two-way ANOVA). f, NAO staining was used to determine mitochondrial mass in KrasWT/WT (WT/WT), KrasG12D/WT (G12D/WT) and KrasG12D/G12D (G12D/G12D) MEFs. Geometric mean of NAO fluorescence in cells was determined by FACS. Representative overlay (left panel) and geometric mean (right panel) displayed. g, Mitochondrial architecture was examined after Mitotracker green staining in WT/WT, G12D/WT and G12D/G12D MEFs (scale= 10μm). h, TMRM staining was used to determine mitochondrial membrane potential in MEFs of indicated genotypes. Geometric mean of TMRM fluorescence in cells was determined by FACS. Representative overlay (left panel) and geometric mean (right panel) displayed. e-h, Representative data of 3 independent MEFs/genotype show mean of triplicates ±s.d., ***P<0.001, one-way ANOVA.

