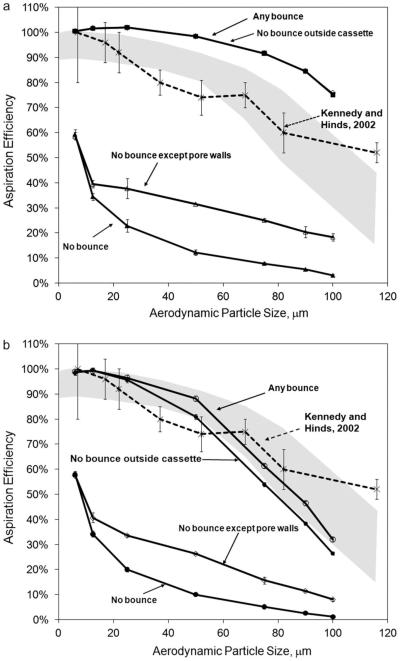
Fig. 5.
Aspiration efficiency (%) as a function of particle size and bounce condition for (a) 0° down and (b) 30° down orientations of sampler on torso. The gray band indicates the range of human aspiration efficiencies reported from humanoid CFD simulations with facing-the-wind orientation, 0.4 m s−1 freestream velocity, and moderate to at-rest breathing rates. The dashed line is from Kennedy and Hinds (2002), mannequin studies of solid aerosol aspiration. Error bars indicate the uncertainty associated with the methods used to generate critical area and aspiration efficiency; in some cases, these values are obstructed by the size of the data marker.

