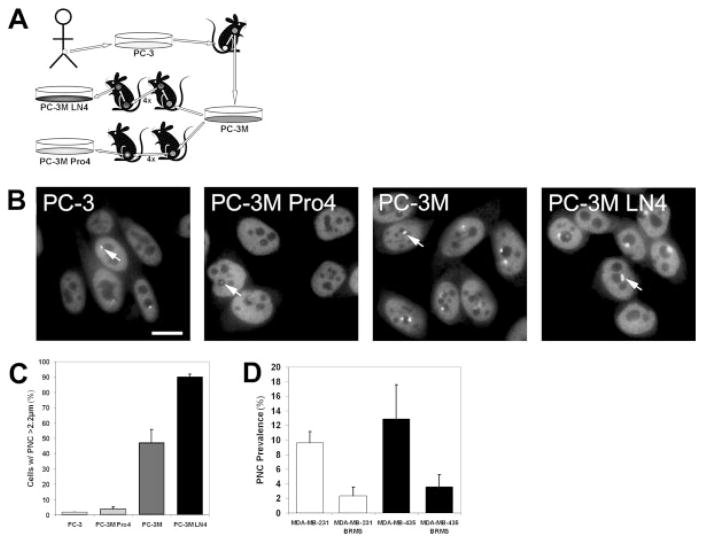
FIGURE 3.
Perinucleolar compartment (PNC) prevalence (the percentage of cells with 1 or more PNC) represents metastatic behavior. (A) Schematic of the creation of the PC-3 series of cell lines. (B) Immunofluorescent staining was used against polypyrimide tract binding protein (PTB) to show the PNCs in the PC-3 series of cell lines. Photomicrographs were captured with the same exposure parameters and are displayed with consistent contrast and brightness. Arrows indicate representative PNCs for each cell line. Scale bar = 10 μm. (C) PNC prevalence in the PC-3 series adjusted to the percentage of cells with a greatest PNC dimension >2.2 μm. (D) PNC prevalence in breast cancer cell lines that stably express breast cancer-related metastatic suppressor 1 (BRMS1) and in the parental lines.

