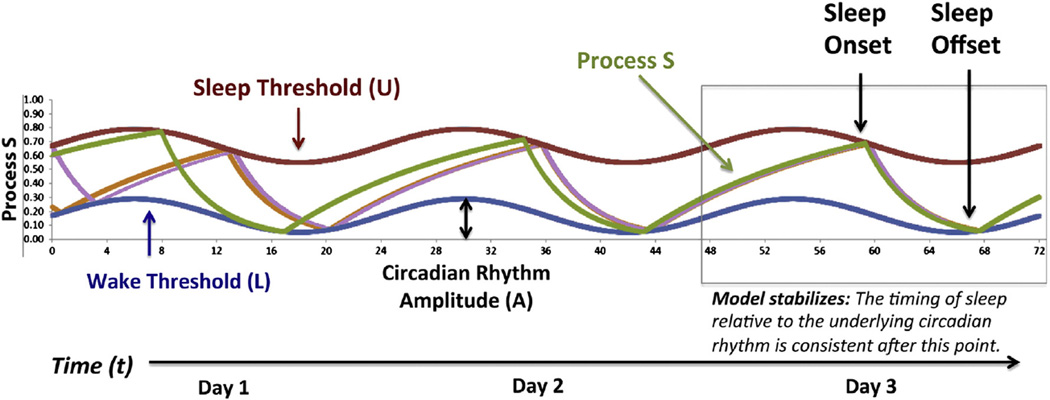
Fig. 2.
The 2-process model illustrates interactions between the circadian and homeostatic regulation of sleep. In this model, the homeostatic drive to sleep (Process S, green) is represented by a set of two exponential functions: a saturating build up of sleep pressure during waking (St + 1 = 1 − (1 − St) * e−Δt/τi, with a time constant of τi = 18.18 h and an instantaneous build up rate of 0.055/h) and a rapid decline during sleep (St + 1 = St * e−Δt/τd, with a time constant of τd = 4.2 h and an instantaneous break down rate of 0.238/h). These time constants were originally derived from observations of a physiological correlate of sleep pressure during human sleep deprivation experiments: the build-up and dissipation of slow wave activity (SWA; Daan et al., 1984). Thus, the y-axis of this figure, which spans from 0 to 1, ultimately represents the theoretical upper and lower asymptotes for SWA generation. In this figure, three days of simulated data are presented, with time (t, hrs) indicated by the x-axis. Using parameters optimized to fit the sleep patterns of young adults (Daan et al., 1984), Process S in the model is allowed to fluctuate between a sinusoidal lower “wake threshold” (L, blue, average value of 0.17) and upper “sleep threshold” (U, red, average value of 0.67), representing the circadian regulation of sleep (Process C) with a rhythm amplitude of A = 0.12. Thus, time awake is denoted by the rising slope of S, and time of sleep is denoted by the falling slope. In general, this model will progress towards a stable (ideal) timing of sleep and wake, even when initial levels of sleep pressure differ (S, orange and lavender lines).

