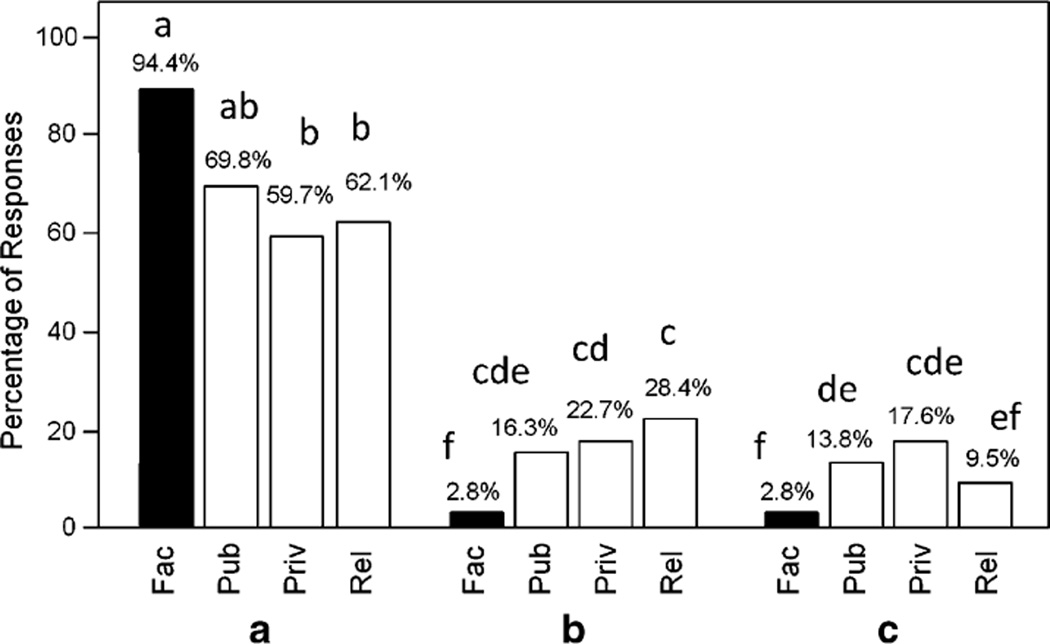
Fig. 6.
Percentage of New England faculty (Fac, black bars) versus college students (white bars) from public secular (Pub), private secular (Priv), and religious (Rel) institutions who believe one of the following statements describes them best: A I accept evolution and express it openly regardless of others’ opinions; B no opinion; and C I accept evolution but do not discuss it openly to avoid conflicts with friends and family. Comparisons among groups: Chi-square=41.326; df=6; P≤0.001; lowercase letters indicate sign test two-tail pair-wise comparisons, P≤0.05. Fac, n=216; Pub, n=116; Priv, n=273; and Rel, n=169

