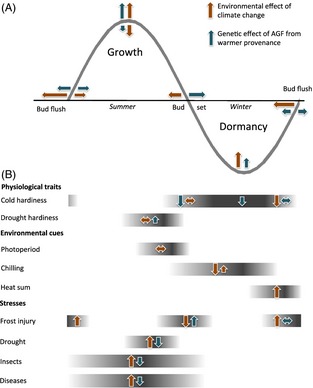
Figure 2.

(A) A schematic diagram of the annual developmental cycle of temperate and boreal trees for 1 year illustrating the timing of growth, dormancy and bud phenology, modelled after the degree growth stage model of Fuchigami et al. (1982). (B) The timing of physiological changes, environmental cues, and biotic and abiotic stresses. Orange arrows illustrate the expected environmental effects of climate change (timing, magnitude and direction); blue arrows indicate the expected genetic changes in phenotypic traits and vulnerability resulting from assisted gene flow from populations matching projected new conditions.
