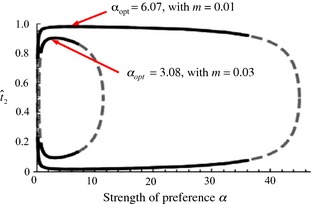
Figure 2.

The amount of trait divergence between two populations exchanging migrants under assortative mating by phenotype matching, as a function of the strength of preferences, α, for two different migration rates (m = 0.01 and m = 0.03). The lines shown are equilibrium frequencies of the trait T2 in population 2; as the identity of the ‘local’ trait is interchangeable in a model with only phenotype matching, if T2 is at the frequency shown by the top line in population 2, then T1 will be at the same frequency in population 1. The difference between the two lines can thus be considered a measure of the divergence between the traits across the two populations. The solid black line is a stable equilibrium line reached from the assumption of secondary contact between divergent populations and the dashed gray line is an unstable equilibrium. Stable lines of equilibrium where both populations are fixed for T2 or for T1 and an unstable equilibrium at 0.5 are not shown on the figure. The value of α that leads to the maximum amount of divergence between the populations, αopt, is labeled for each migration rate (differentiation cannot be maintained if migration rates are too high). Redrawn with permission from Servedio (2011).
