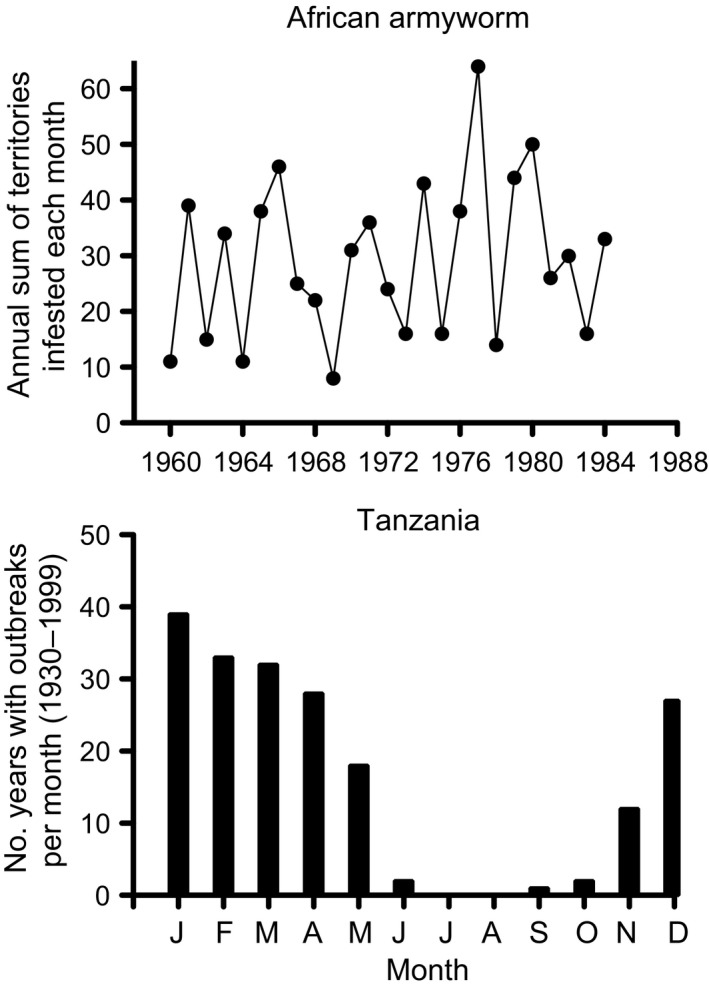
Figure 5.

Top – The annual sum of the number of territories recording larval infestations of S. exempta in East Africa from 1940 to 1984. Data summarized from Haggis (1986). Bottom – Number of years with recorded outbreaks of S. exempta in Tanzania summed on a monthly basis for 1930 to 1999 (from table 1 in Rose et al. (2000).
