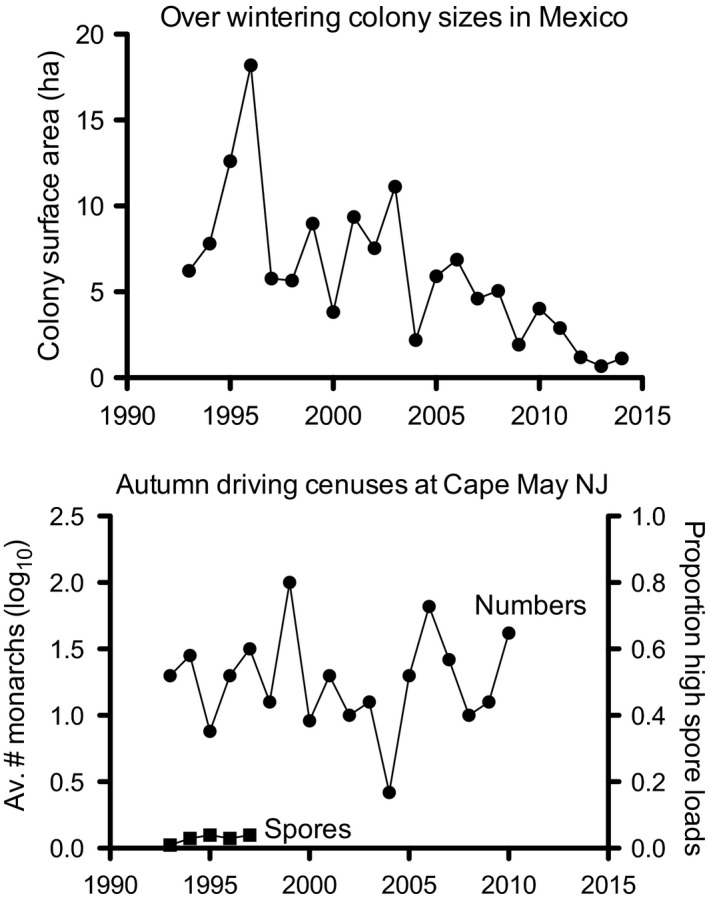
Figure 8.

Top. Monarch populations are estimated over time by the area of overwintering butterfly colonies (data from Vidal and Rendón‐Salinas 2014). Bottom. Total counts of butterflies made in driving censuses at Cape May NJ (circles – data from Davis 2012) and the proportion of individuals with high spore loads (squares) recorded for Eastern migratory populations by Altizer et al. (2000).
