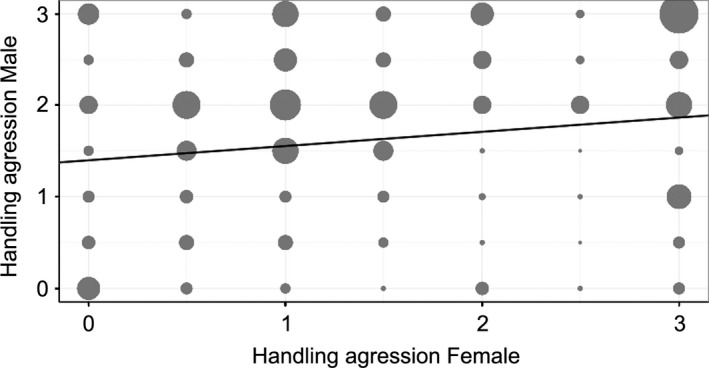
Figure 3.

Relationship between handling aggression scores (0 to 3, with 0 no aggressive behaviour and 3 maximum aggressiveness) of male and female social partners in Corsican populations (E‐Pirio, D‐Muro and E‐Muro) from 2011 to 2014; the slope (0.156, 95% CI = [0.054;0.260]) and intercept (1.400, 95% CI = [1.084;1.751]) of the line are derived from a linear mixed model (Bayesian framework) with females handling aggression score as response variable, partner handling aggression score and year as fixed effects and female identity, partner identity and handling aggression observer as random effects; n = 336 females, 345 males, 10 observers. The size of the points refers to the number of pairs with a given combination of handling aggression scores (min = 2, max = 24).
