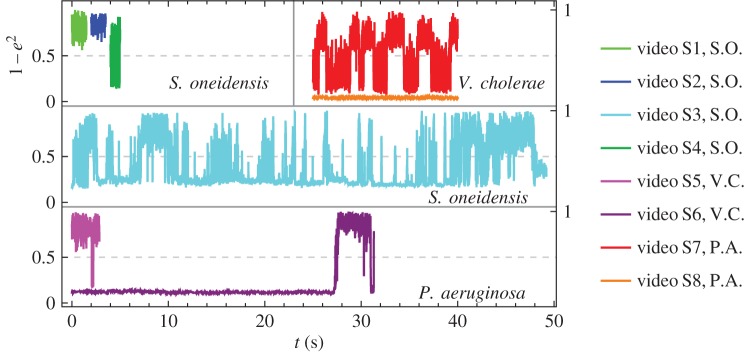
Figure 2.
Normalized tilt angles from experimental observations versus real time, calculated as 1−e2, where e is eccentricity of a fitted ellipse (see the electronic supplementary material). When the value approaches 0, the bacterium is in a horizontal orientation; when the value approaches 1, the bacterium is in a vertical position. Each colour corresponds to a different video and the species is indicated by the initials in the legend.

