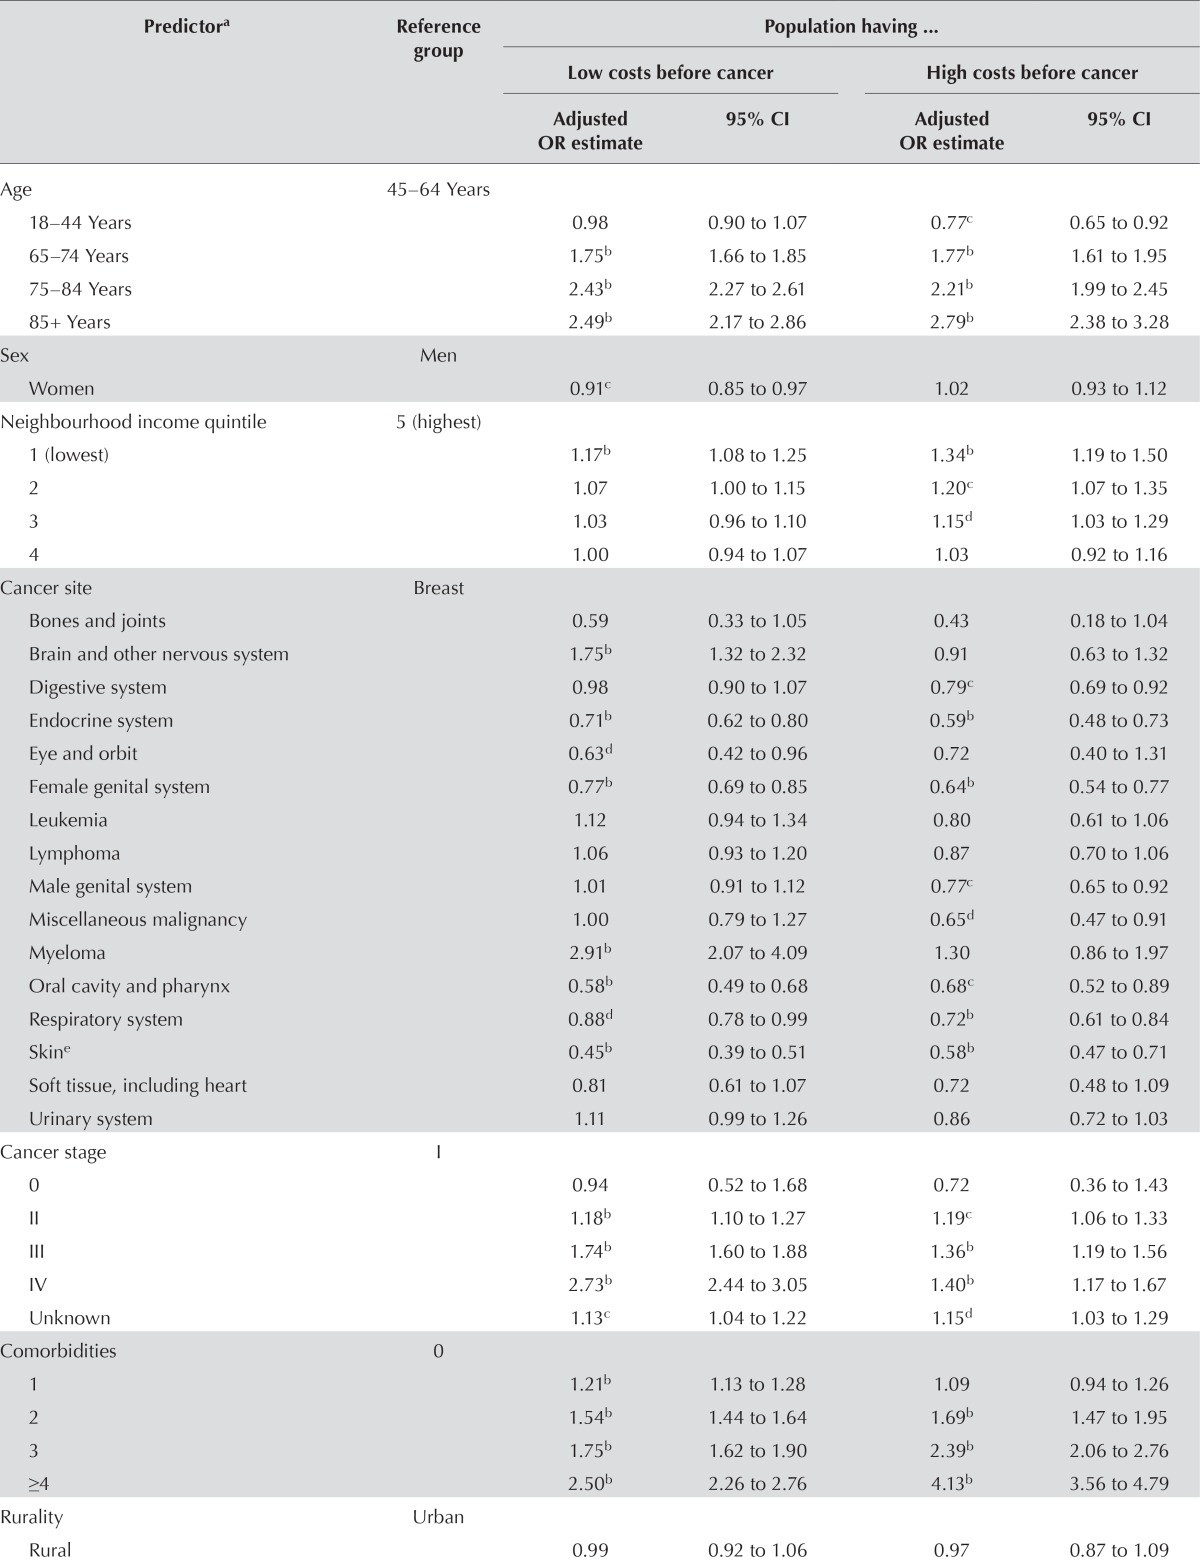
TABLE VI.
Logistic regression model predicting high costs after cancer treatment
| Predictora | Reference group | Population having ... | |||
|---|---|---|---|---|---|
|
| |||||
| Low costs before cancer | High costs before cancer | ||||
|
|
|
||||
| Adjusted OR estimate | 95% CI | Adjusted OR estimate | 95% CI | ||
| Age | 45–64 Years | ||||
| 18–44 Years | 0.98 | 0.90 to 1.07 | 0.77c | 0.65 to 0.92 | |
| 65–74 Years | 1.75b | 1.66 to 1.85 | 1.77b | 1.61 to 1.95 | |
| 75–84 Years | 2.43b | 2.27 to 2.61 | 2.21b | 1.99 to 2.45 | |
| 85+ Years | 2.49b | 2.17 to 2.86 | 2.79b | 2.38 to 3.28 | |
| Sex | Men | ||||
| Women | 0.91c | 0.85 to 0.97 | 1.02 | 0.93 to 1.12 | |
| Neighbourhood income quintile | 5 (highest) | ||||
| 1 (lowest) | 1.17b | 1.08 to 1.25 | 1.34b | 1.19 to 1.50 | |
| 2 | 1.07 | 1.00 to 1.15 | 1.20c | 1.07 to 1.35 | |
| 3 | 1.03 | 0.96 to 1.10 | 1.15d | 1.03 to 1.29 | |
| 4 | 1.00 | 0.94 to 1.07 | 1.03 | 0.92 to 1.16 | |
| Cancer site | Breast | ||||
| Bones and joints | 0.59 | 0.33 to 1.05 | 0.43 | 0.18 to 1.04 | |
| Brain and other nervous system | 1.75b | 1.32 to 2.32 | 0.91 | 0.63 to 1.32 | |
| Digestive system | 0.98 | 0.90 to 1.07 | 0.79c | 0.69 to 0.92 | |
| Endocrine system | 0.71b | 0.62 to 0.80 | 0.59b | 0.48 to 0.73 | |
| Eye and orbit | 0.63d | 0.42 to 0.96 | 0.72 | 0.40 to 1.31 | |
| Female genital system | 0.77b | 0.69 to 0.85 | 0.64b | 0.54 to 0.77 | |
| Leukemia | 1.12 | 0.94 to 1.34 | 0.80 | 0.61 to 1.06 | |
| Lymphoma | 1.06 | 0.93 to 1.20 | 0.87 | 0.70 to 1.06 | |
| Male genital system | 1.01 | 0.91 to 1.12 | 0.77c | 0.65 to 0.92 | |
| Miscellaneous malignancy | 1.00 | 0.79 to 1.27 | 0.65d | 0.47 to 0.91 | |
| Myeloma | 2.91b | 2.07 to 4.09 | 1.30 | 0.86 to 1.97 | |
| Oral cavity and pharynx | 0.58b | 0.49 to 0.68 | 0.68c | 0.52 to 0.89 | |
| Respiratory system | 0.88d | 0.78 to 0.99 | 0.72b | 0.61 to 0.84 | |
| Skine | 0.45b | 0.39 to 0.51 | 0.58b | 0.47 to 0.71 | |
| Soft tissue, including heart | 0.81 | 0.61 to 1.07 | 0.72 | 0.48 to 1.09 | |
| Urinary system | 1.11 | 0.99 to 1.26 | 0.86 | 0.72 to 1.03 | |
| Cancer stage | I | ||||
| 0 | 0.94 | 0.52 to 1.68 | 0.72 | 0.36 to 1.43 | |
| II | 1.18b | 1.10 to 1.27 | 1.19c | 1.06 to 1.33 | |
| III | 1.74b | 1.60 to 1.88 | 1.36b | 1.19 to 1.56 | |
| IV | 2.73b | 2.44 to 3.05 | 1.40b | 1.17 to 1.67 | |
| Unknown | 1.13c | 1.04 to 1.22 | 1.15d | 1.03 to 1.29 | |
| Comorbidities | 0 | ||||
| 1 | 1.21b | 1.13 to 1.28 | 1.09 | 0.94 to 1.26 | |
| 2 | 1.54b | 1.44 to 1.64 | 1.69b | 1.47 to 1.95 | |
| 3 | 1.75b | 1.62 to 1.90 | 2.39b | 2.06 to 2.76 | |
| ≥4 | 2.50b | 2.26 to 2.76 | 4.13b | 3.56 to 4.79 | |
| Rurality | Urban | ||||
| Rural | 0.99 | 0.92 to 1.06 | 0.97 | 0.87 to 1.09 | |
| Continuity of care index | Low | ||||
| High | 0.91b | 0.86 to 0.95 | 0.89c | 0.82 to 0.96 | |
| Primary care model | Traditional FFS | ||||
| Enrolment FFS | 0.93 | 0.87 to 1.01 | 0.94 | 0.83 to 1.06 | |
| Enrolment capitation | 0.97 | 0.89 to 1.05 | 1.02 | 0.89 to 1.17 | |
| Team capitation | 1.07 | 0.99 to 1.16 | 1.07 | 0.94 to 1.22 | |
| Other | 1.04 | 0.84 to 1.30 | 1.12 | 0.82 to 1.54 | |
| Length of cancer episode | 1.01b | 1.01 to 1.02 | 1.01d | 1.00 to 1.02 | |
| Visits per month to ... | |||||
| Specialist, non-cancer-related | 1.09b | 1.08 to 1.10 | 1.08b | 1.06 to 1.09 | |
| Family physician, non-cancer related | 1.06b | 1.04 to 1.08 | 1.08b | 1.06 to 1.11 | |
| Family physician, cancer related | 1.02 | 0.99 to 1.05 | 0.95b | 0.92 to 0.98 | |
| Specialist, cancer-related, and Oncology | 1.03b | 1.02 to 1.04 | 1.01 | 0.99 to 1.03 | |
The predictive models were adjusted for Local Health Integration Network; however, any effects were nonsignificant (data not shown).
p < 0.001.
p < 0.01.
p < 0.05.
Excluding basal and squamous cell.
OR = odds ratio; CI = confidence interval; FFS = fee-for-service.

