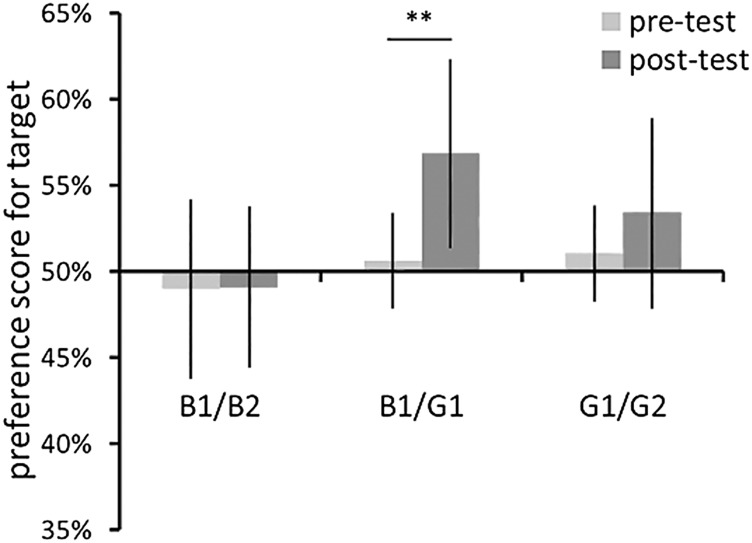
Fig. 3.
Mean preference scores for novel stimuli in the habituation experiment. Error bars indicate ±SEM. Results for the pretest phase are indicated by light gray bars, and results for the posttest phase are indicated by dark gray bars. A significant difference was found only in the between-category pair. Asterisks indicate a statistically significant difference: **P < 0.01.

