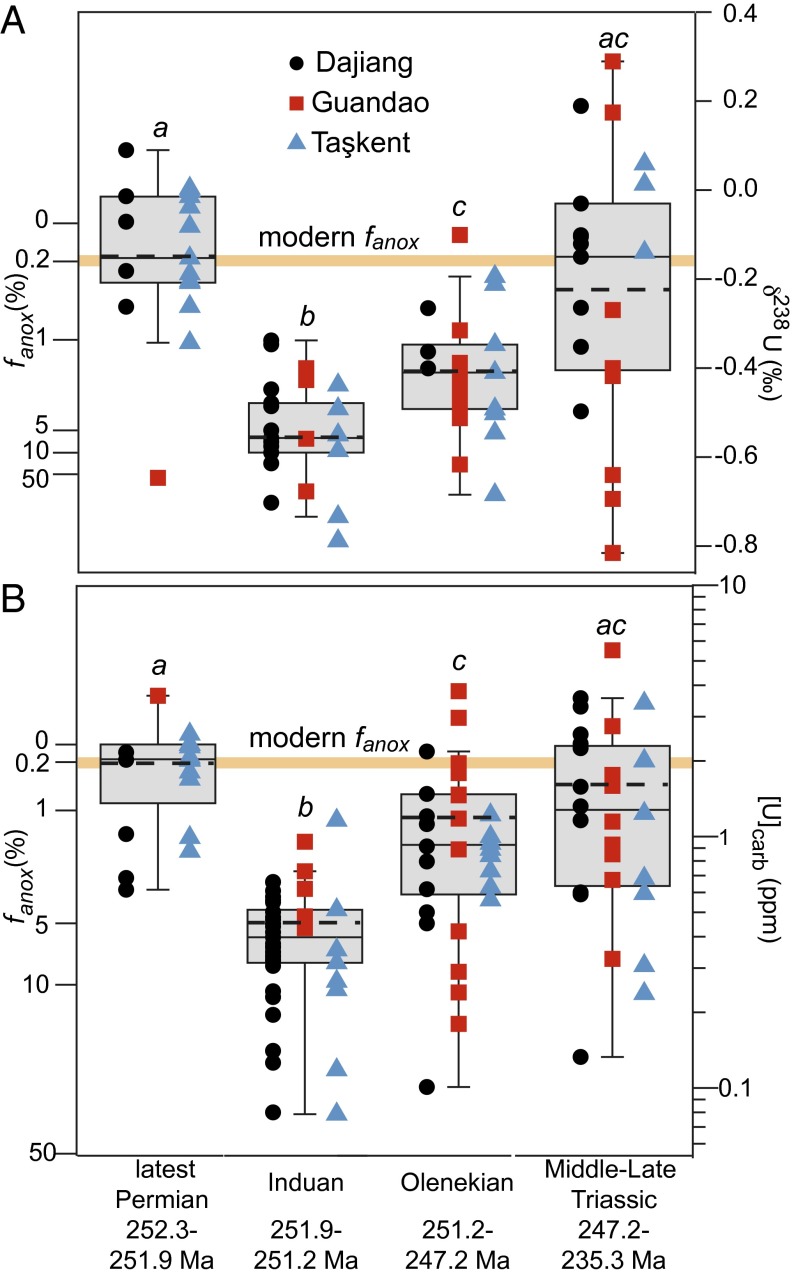
Fig. 3.
(A) The δ238U and (B) [U] boxplots. Whiskers denote the minimum and maximum of data within 1.5 times the interquartile range from the median. The mean is marked by the dashed line. Steady-state model predictions for the extent of anoxia, fanox, are calculated for the best-estimate input δ238Uriv composition of −0.05‰ (Middle Trassic δ238U Composition), and suggest that, in the Late Permian and Late−Middle Triassic, the extent of anoxia was near the modern value, whereas, in the Early Triassic, the extent was larger. Statistical analyses show that latest Permian δ238U and [U] data (a) are significantly distinct from the Induan (b) but similar to the Middle−Late Triassic, whereas the Olenekian data represent a transitional period (c).

