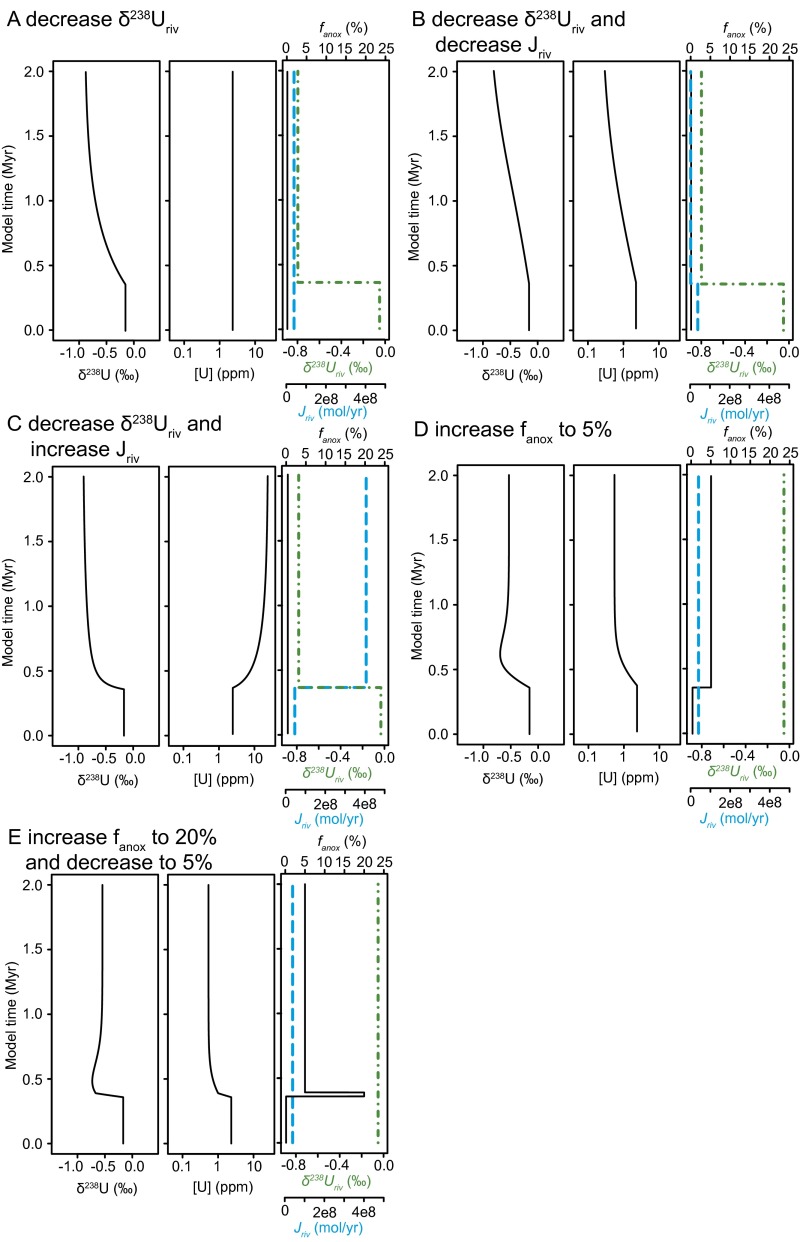
Fig. S6.
Details of box model predictions. Predicted carbonate δ238U and [U] behavior, where the third panel depicts temporal variation in forcing parameters fanox (black solid line), Jriv (cyan dashed line), and δ238Uriv (green dot-dashed line). (A) Decrease δ238Uriv to −0.8‰. (B) Decrease δ238Uriv to −0.8‰ and Jriv by an order of magnitude. (C) Decrease δ238Uriv to −0.8‰ and increase Jriv by an order of magnitude. (D) Increase fanox to 5%, comparable to steady-state estimate of increased anoxia from ref. 11. (E) Increase fanox to 20% for 3 × 10⁵ y and maintain at 5% for 1 My.

