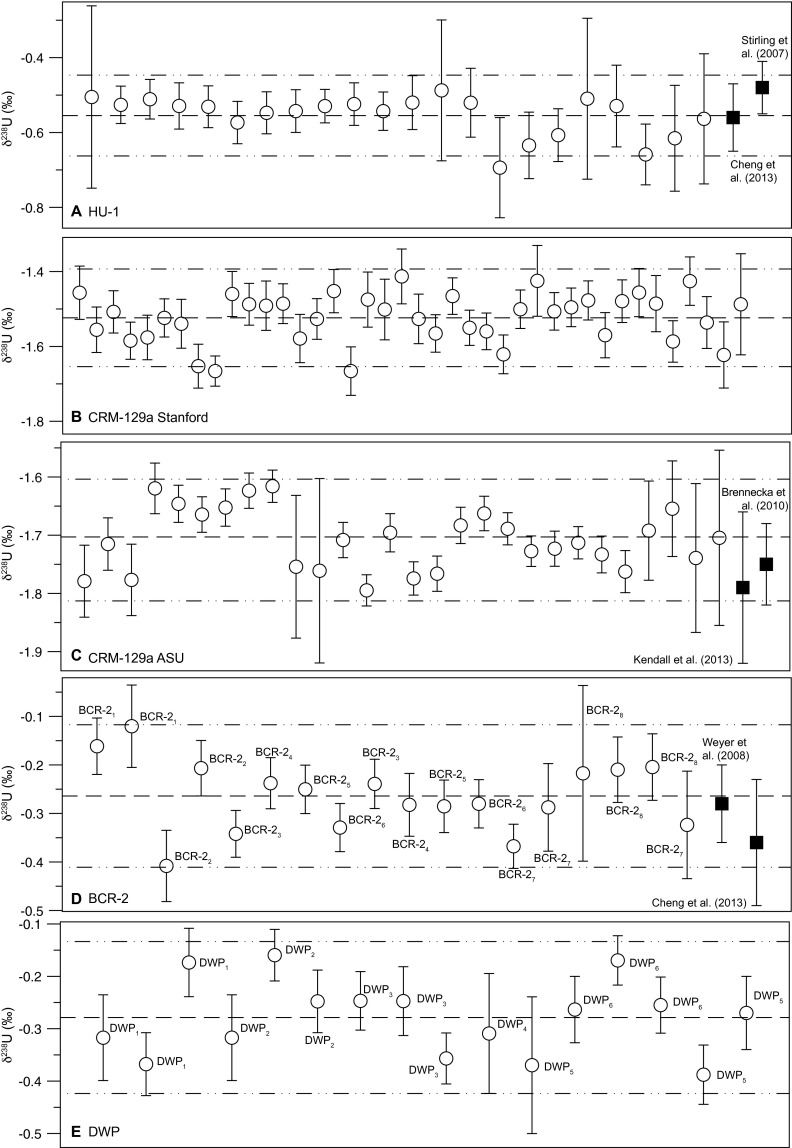
Fig. S11.
Reproducibility of standards. Our data are shown in open circles, and published values are shown as black squares. Dotted lines show the mean and 2σ of the δ238U of all analyses. (A) Measurements of HU-1 solution. (B) Measurements of Stanford CRM-129a and (C) separate aliquot of CRM-129a obtained from ASU. (D) Measurements of rock standard BCR-2. Error bars are 2 SE on the measurement (internal precision) for our data and 2 SD on total replicates for published data. Each data point represents a measurement of a total of eight replicates of BCR-2 (dissolved from powder), illustrated here by subscripts. (E) Measurements of internal carbonate standard DWP. Error bars are 2 SE on the measurement (internal precision) for our data. A total of six complete replicates of DWP (dissolved from powder) were measured, as denoted by the subscripts. Raw data are also presented in Dataset S1.

