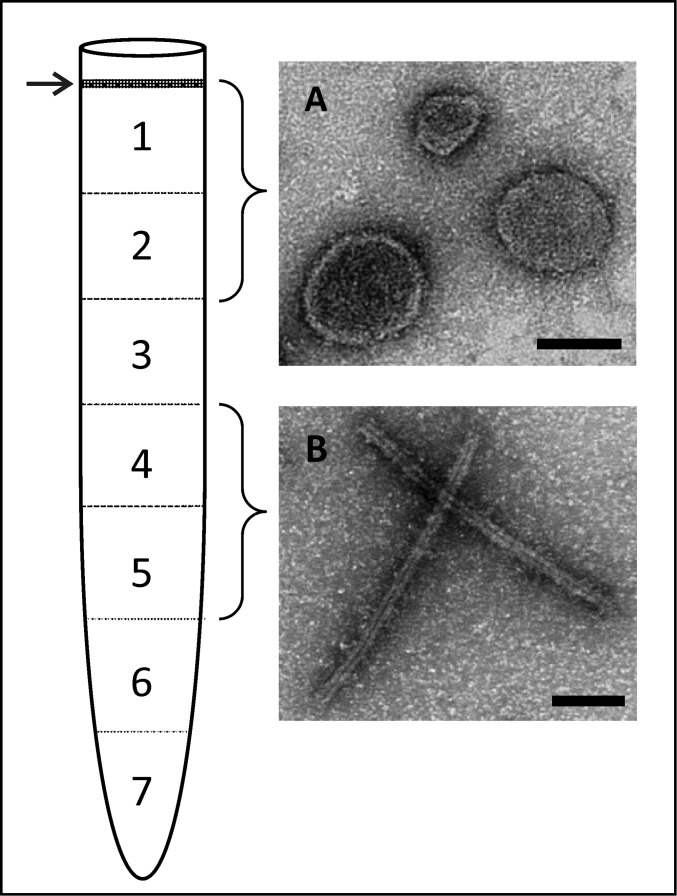
Fig. S8.
Separation by CsCl gradient centrifugation of PFV1 virion constituents obtained by Triton X-100 treatment. In the scheme on the left, the arrow indicates the visible band, and numbers correspond to collected fractions. (A) Electron micrographs of particles observed in the visible band and fractions 1 and 2. (B) Electron micrographs of particles observed in fractions 4 and 5. Negative stain with 2% uranyl acetate. (Scale bars: 100 nm.)

