Fig. 2.
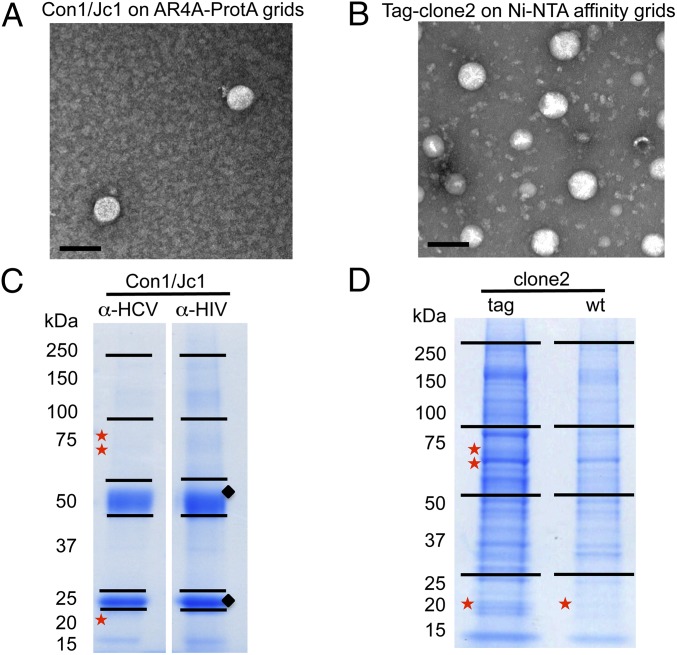
Analysis of purified HCV virions. (A and B) Transmission EM images of purified HCV particles used for proteomics studies. (Scale bars, 100 nm.) (C and D) Coomassie staining of SDS/PAGE gels subjected to proteomics analysis. Stars indicate the slices where E2, NS3, and Core (top to bottom) were detected; diamonds show the heavy and light Ab chains. Ni-NTA, nickel-nitrilotriacetic acid; wt, wild type.

