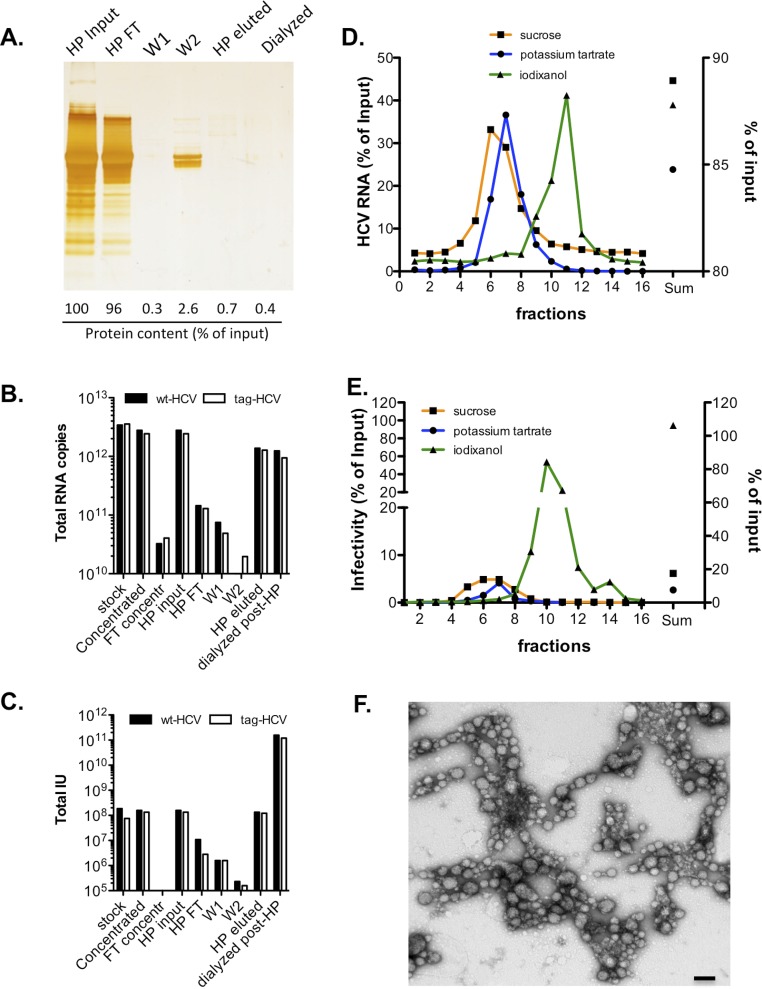
Fig. S1.
Tracking purity and infectivity throughout the purification steps. (A) Proteins in HCV-containing supernatants before and after heparin (HP) purification were separated with 4–12% (wt/vol) SDS-polyacrylamide gel and were visualized by silver staining. Quantification of protein content in each sample was carried out with a Bradford assay and is shown as a percentage of the input sample (stirred cell-concentrated HCV supernatant). FT, flow-through; W, wash. Number of total HCV genomes (B) and total infectious units (IU) (C) recovered during HP purification of wild-type (wt)–HCV and tag-HCV. (D and E) Clone 2 was sedimented through different gradients. The HCV RNA content (D) and infectivity (E) of each fraction were measured and are expressed as a percentage of input sample. The sum of all fractions is shown on the right y axis. (F) Infectious tag-HCV particles from iodixanol gradients were bound to His-Dynabeads, eluted with imidazole, and applied to regular carbon EM grids for negative staining analysis. A representative TEM image shows aggregation of purified HCV particles. (Scale bar, 100 nm.)

