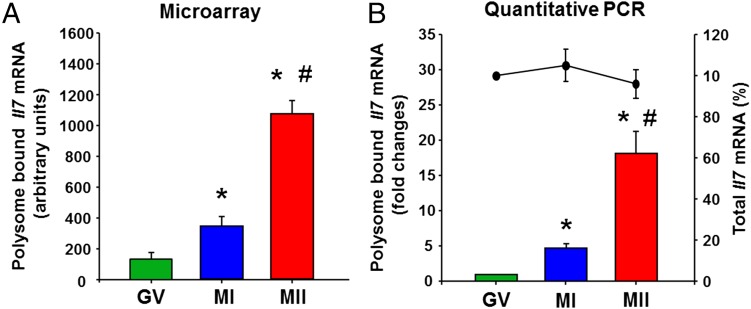
Fig. 2.
Il7 mRNA translation during in vivo oocyte maturation. (A) Microarray analysis of Il7 mRNA in the polysome fraction during oocyte maturation. *P < 0.05 vs. GV; #P < 0.05 vs. MI, ANOVA. (B) Quantitative PCR analysis of Il7 mRNA in polysome fractions (bar graph) and whole-cell lysates (line plot) during oocyte maturation. *P < 0.05 vs. GV; #P < 0.05 vs. MI, ANOVA. Error bars correspond to the SEM, and data are from three experiments from biologically distinct samples.

