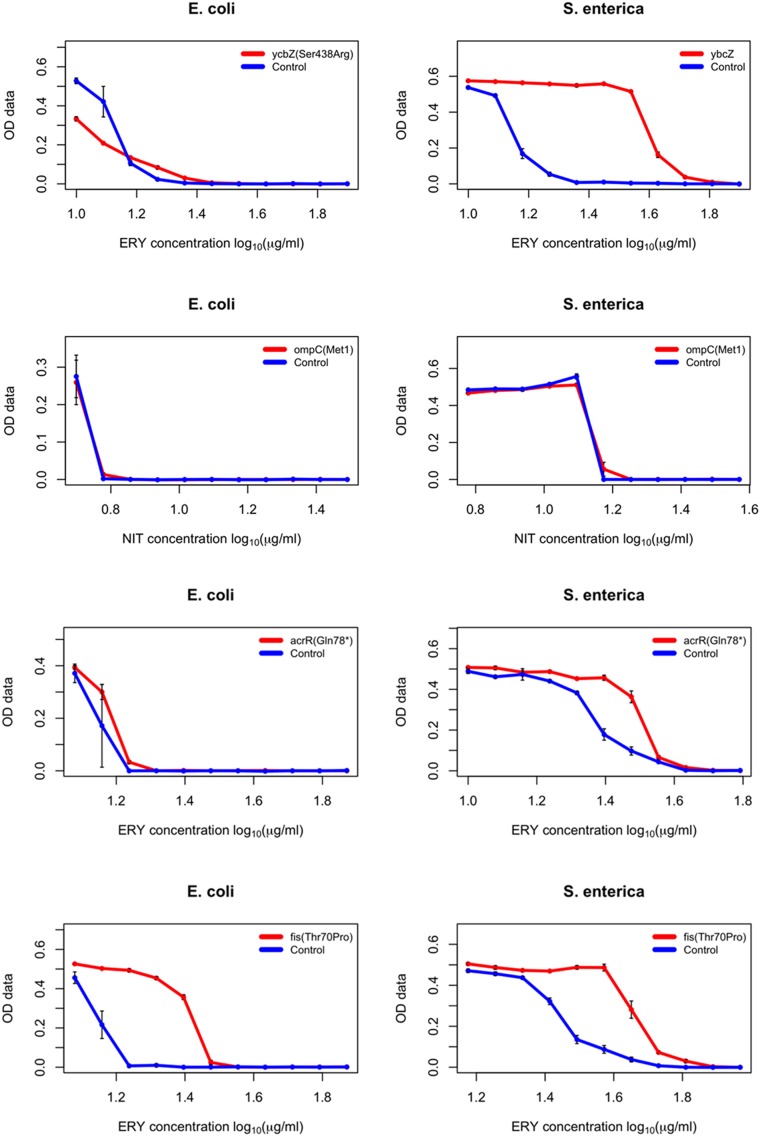
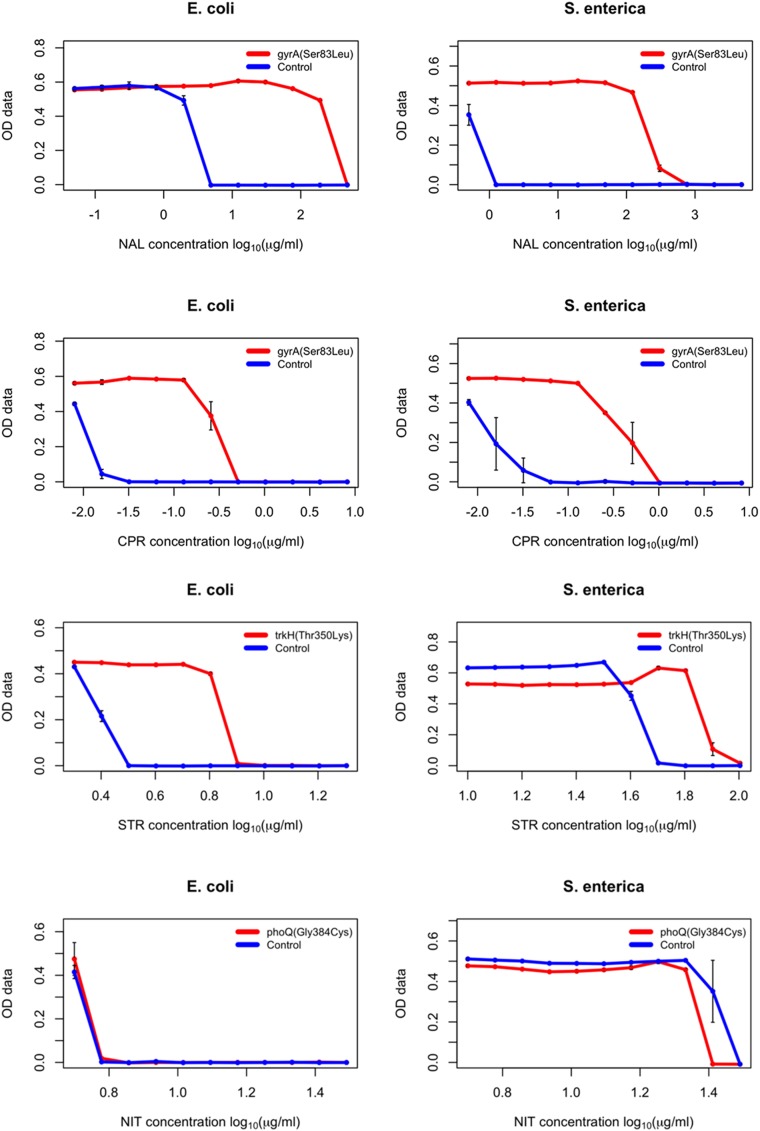
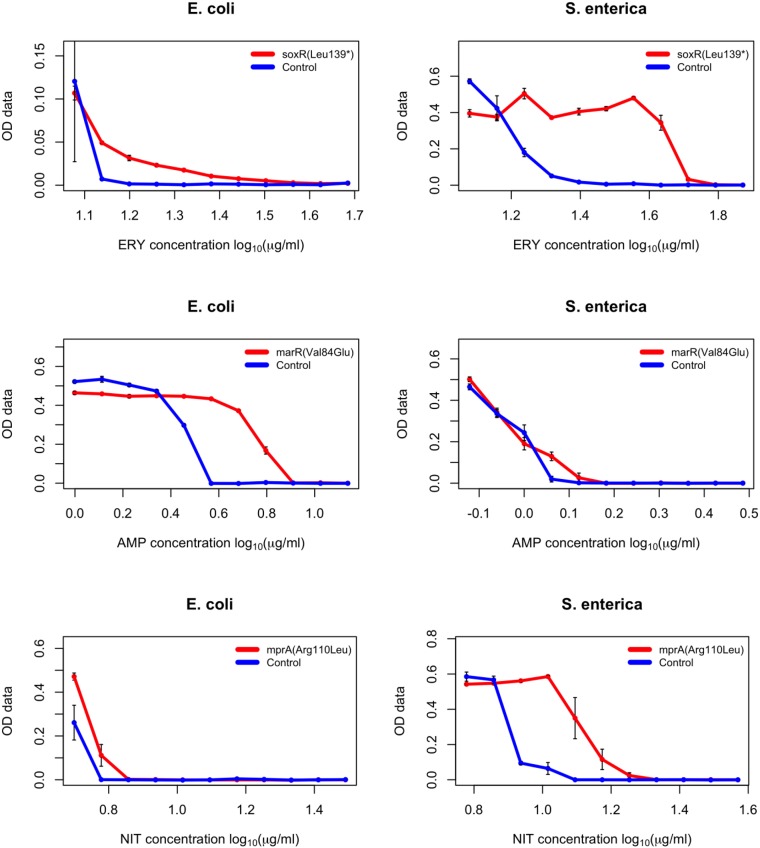
Fig. S8.
Dose–response curves of the generated E. coli and S. enterica mutants (specific mutation indicated in the chart legends) each compared with the wild-type ancestral strain (E. coli BW25113 and S. enterica serovar Typhimurium LT2, respectively) to determine relative MIC values of given antibiotics (indicated at the bottom of each chart). Each strain was measured in three replicates, error bars represent SEMs. OD data indicated on the y axis represents optical density measurements taken at 600 nm.


