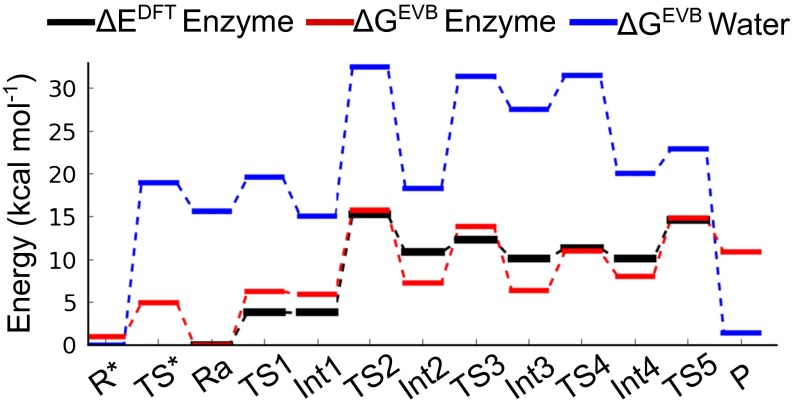
Fig. 2.
Calculated energetics of cytidine deamination in the enzyme and for a reference reaction in water following the same mechanism. The DFT energy profile (black curve) includes the electronic energy calculated at the B3LYP/6-311+G(2p,2d)/LANL2TZ level of theory, ZPE, dispersion, and solvation corrections. The EVB free-energy profiles are each averaged over 20 independent MD/EVB simulations of the enzyme (red curve) and water (blue curve) reactions at 300 K.

