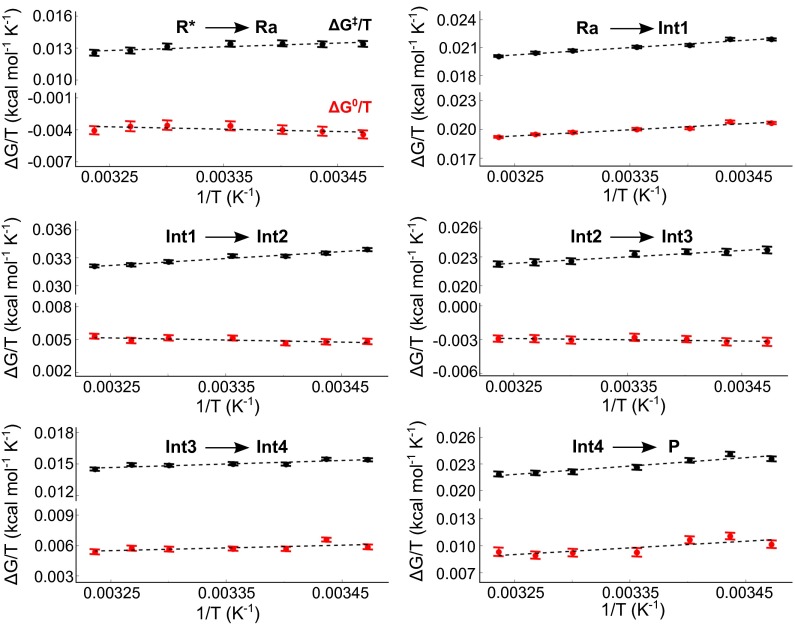
Fig. 4.
Calculated temperature dependence of the different reaction steps in the enzyme. Computed Arrhenius and van’t Hoff plots of the activation and reaction free energies and versus are shown with black and red data points, respectively, for each reaction step. Each data point is the average of 130 independent MD/EVB simulations, with error bars denoting the SEM. The temperature interval is 288–309 K.

