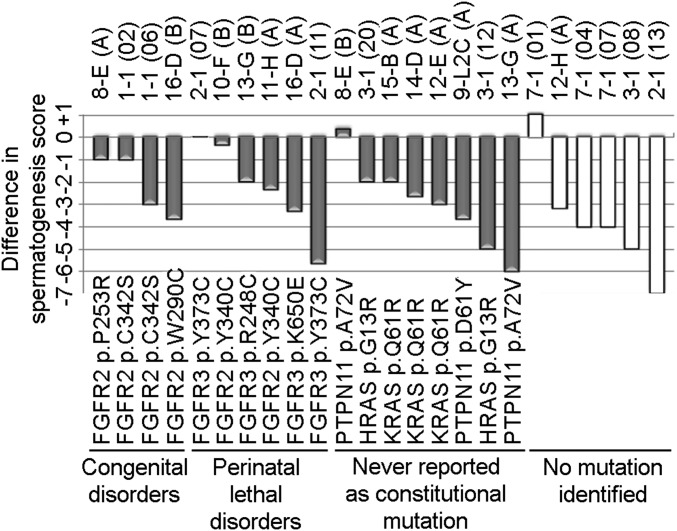
Fig. 3.
Analysis of spermatogenesis in immunopositive tubules. The difference in Johnsen scores between paired immunopositive and adjacent normal tubules is plotted for each pair; Johnsen scores range between 1 (no seminiferous epithelium) and 10 (full spermatogenesis). In pairwise analysis, the Johnsen score is significantly lower in immunopositive than in normal-staining tubules (P = 5.2 × 10⁻⁵, Wilcoxon signed rank test).

