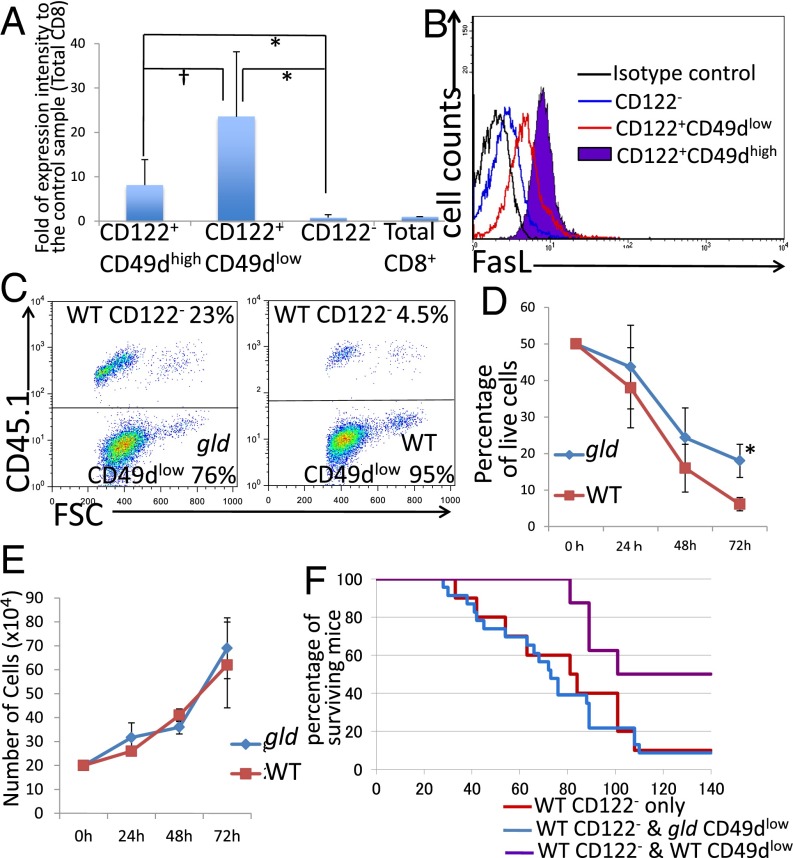
Fig. 3.
(A) Analysis of RNA expression level of FasL in each population of CD8+ T cells by real-time PCR. For each sample, FasL mRNA levels were normalized to β-actin and are expressed as fold change relative to the control sample (1.00). †Not significantly different (P > 0.05, Student’s t test); **significantly different (P < 0.01, Student’s t test). (B) Analysis of FasL expression of flow cytometory. (C and D) Analysis of coculture of CD8+CD122−CD45.1+ T cells and CD49dlow from gld or WT mice. (C) Representative results obtained from three independent experiments. (D) *Significantly different (P < 0.05, Student’s t test). (E) Cell growth analysis of CD49dlow T cells from gld mice and WT mice. At all time points, the results obtained from two different mice were not significantly different (P > 0.05, Student’s t test). (F) Analysis of adoptive T-cell transfer of CD122− T cells (WT) mixed with CD49dlow T cells (WT or gld) into RAG-2–deficient mice. Addition of gld mice-derived CD49dlow T cells to CD122− cells (blue line) had no significant effect on survival compared with transfer of CD122− cells alone (red line; log-rank test, P = 0.7608; Wilcoxon test, P = 0.6859).

