Fig. 5.
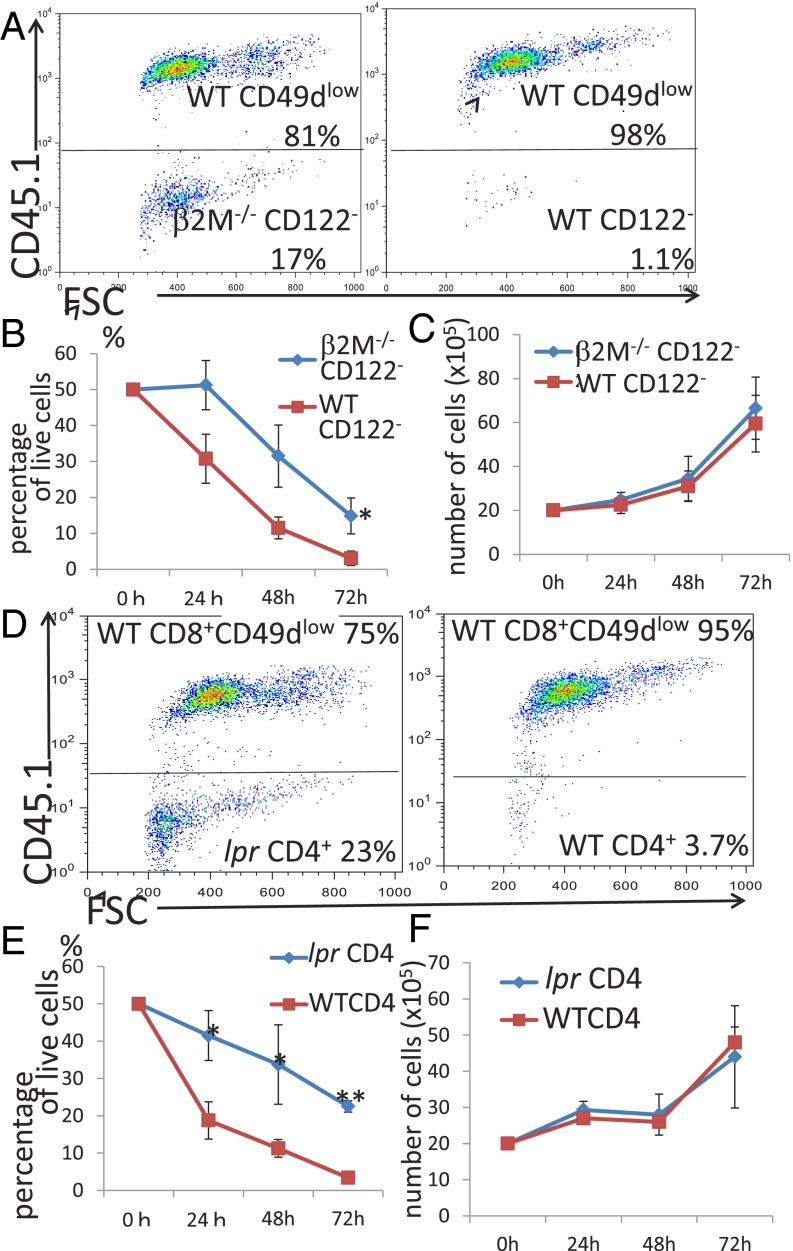
(A and B) Analysis of coculture of CD49dlow cells (CD45.1) with CD8+CD122− cells (CD45.2) derived from mice in which the bone marrow had been replaced with that from β2M (β2-microglobulin)-deficient mice. (A, Left) CD49dlow (CD45.1+) cocultured with CD122−(β2MKO) for 72 h. (A, Right) CD49dlow (CD45.1+) cocultured with CD122− (WT) for 72 h. Representative results after 72 h of coculture obtained from three independent experiments are shown. (B) The percentages of CD8+CD122− cells among total live cells are shown in three independent experiments. *Significantly different (P < 0.05, Student’s t test). (C) Absolute numbers of CD8+CD122− T cells derived from WT mice or from mice (β2MKO) in simple culture. At all time points, no significant differences were found (P > 0.05, Student’s t test). (D and E) Analysis of coculture of CD49dlow T cells (CD45.1+) with CD4+CD25− T cells derived from lpr or WT mice. (D, Left) CD49dlow(CD45.1+) cocultured with CD4+ (lpr) for 72 h. (D, Right) CD49dlow(CD45.1+) cocultured with CD4+ (WT) for 72 h. Representative results after 72 h of coculture obtained from three independent experiments are shown. (E) Percentages of CD4+ cells among total live cells are shown. Data were obtained from three independent experiments. *P < 0.05, Student’s t test; **P < 0.01, Student’s t test. (F) CD4+CD25− T cells derived from WT and lpr mice were harvested, and the absolute numbers of live cells were determined. Average values of three independent experiments are shown. At all time points, the values were not significantly different (P > 0.05, Student’s t test).

